Skip to Main Content
Hollywood Market Moves

Q2 2026  ·  Quarterly Market Report

INSIDE Q2 2026

Your window into the energy, economy, and evolution of the Hollywood Entertainment District. Hollywood’s strength as a destination is carrying the district while the workday recovers more slowly — here is what the quarter tells us, and where to look for the detail.

A note from our CEO

Kathleen Rawson on what the quarter tells us

Kathleen Rawson
Kathleen Rawson
President & CEO

Welcome to the Q2 2026 edition of Market Moves. Hollywood entered the summer with strong momentum as a destination, even as the district continued to navigate a slower recovery in its traditional workday economy. Hotels outperformed the nation, retail strengthened, and visitation grew — while the office market remains the clearest area of challenge.

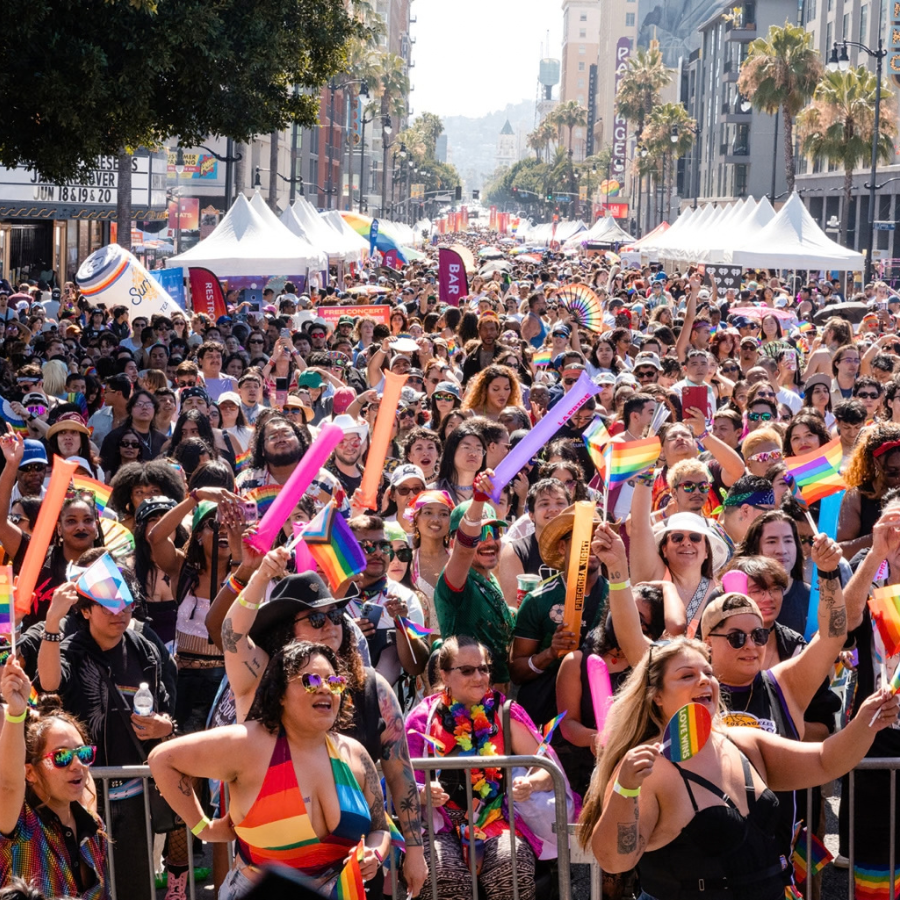
April through June brought Hollywood two of the largest gatherings on its calendar: LA Pride’s 56th parade down Hollywood Boulevard and the opening of the FIFA World Cup in Los Angeles. The district recorded about 9.8 million visits this quarter, up 4% over last year, and June — the month carrying both events — was the busiest of the quarter, up more than 7%. Those figures count domestic visitors only, so the true number is higher still.

Hollywood’s hotels outperformed the country. Nationally, second-quarter revenue per available room rose 5.7%, almost entirely on higher room rates while occupancy barely moved. In the Hollywood Entertainment District, it rose 13.3% — and we grew occupancy and rate together, with occupancy up nearly four points and average daily rate up 7.7%. Greater Hollywood sold 3.0% more room nights than a year ago in a quarter when Greater Los Angeles sold 2.1% fewer. Hollywood did not simply ride a national recovery; it captured demand the region was losing.

The way people use Hollywood is changing. Resident visits rose 18.4% this quarter. Worker visits fell 2.8% and remain about a fifth below where they stood in 2019. That gap is not mainly a Hollywood story: employment in motion picture and sound recording across Los Angeles County stood at roughly 101,000 jobs in June, far below pre-pandemic levels. Our office market reflects an industry’s contraction more than a district’s. Meanwhile, Hollywood is becoming a place people live in and move through rather than commute to, and that shows up in evening and weekend activity across the district.

Quality continues to win, in every asset class. Class A office vacancy stands at 16.8% against 21.1% for the market overall, and nine points below the Greater Los Angeles Class A rate. Premium retail vacancy is 5.7% against 6.3% for everything else. Retail rents here rose 5.7% against 2.4% nationally, vacancy fell two full points to 6.2% while the national rate held flat, and net absorption was positive for a third consecutive quarter. Where Hollywood offers the best product, it holds the strongest demand.

The office market has not yet turned, and we would rather say so plainly. Vacancy rose again this quarter and sits nearly five points above a year ago, with a fifth consecutive quarter of negative absorption. Nationally, office vacancy fell year over year for the second straight quarter and improved in more than half the markets tracked. Hollywood was not among them. What distinguishes us is the comparison to our own region: overall vacancy remains more than two points below the citywide rate, Class A vacancy is nine points lower, asking rents continued to rise, and our quarterly contraction was a fraction of Greater Los Angeles’s.

Meanwhile, investment in Hollywood’s future continues. Echelon Studios topped out in June, and 4,300 homes are under construction or entitled inside the district.

The clearest story of this quarter is that Hollywood’s strength as a destination is carrying the district while the workday recovers more slowly. That is a solid position to work from, and it tells us clearly where the work is.

Thank you for reading.
What this quarter tells us

Five takeaways, each backed by a section of the report

+13.3%RevPAR growth

Hospitality outperformed the nation

Hollywood hotels grew revenue per available room 13.3% against 5.7% nationally — and unlike the national market, gained occupancy and room rate together rather than rate alone. Greater Hollywood room demand rose while Greater Los Angeles lost demand.

+18.4%Resident visits

A neighborhood, not just a destination

Resident visits rose sharply this quarter while worker visits declined. More than 30,000 residents now anchor the district’s daily rhythm, shifting activity toward evenings and weekends and supporting retail, restaurants and services beyond visitor demand.

16.8%Class A office vacancy

Quality continues to win

Class A office vacancy stands at 16.8% against 21.1% market-wide, and nine points below the Greater Los Angeles Class A rate. Premium retail vacancy is 5.7% versus 6.3% for everything else. Where Hollywood offers the best product, it holds the strongest demand.

6.2%Retail vacancy

Retail is tightening

Retail vacancy fell two full points while the national rate held flat, asking rents rose 5.7% against 2.4% nationally, and net absorption was positive for a third consecutive quarter. Hollywood is now the tightest of the three retail markets tracked.

5Consecutive negative quarters

The office market has not yet turned

Vacancy rose again this quarter and absorption was negative for a fifth consecutive quarter, even as national office vacancy declined. Hollywood still runs more than two points below the citywide rate and its contraction is far shallower than the region’s, but the recovery has not yet reached the district.

Where to go next

Seven topics covering everything happening in Hollywood

About the Hollywood Entertainment District

The Hollywood Entertainment District (HED) is a vibrant 80-block neighborhood at the heart of Los Angeles and one of the region’s most iconic and dynamic urban centers. Home to world-famous landmarks, creative industries, diverse businesses, and a thriving residential community, Hollywood is where culture, commerce, and innovation converge every day.

With residents, workers, visitors, and creators moving through the district around the clock, the HED functions simultaneously as a neighborhood, an employment center, a tourism destination, and a cultural engine for the region.

MARKET SNAPSHOT

Hollywood is more than a destination, it's a living ecosystem of residents, workers, and visitors who keep the district vibrant day and night. This snapshot offers a quick look at how people engage with the Hollywood Entertainment District (HED), revealing key trends in activity, visitation, and momentum across work, live, and play.

Data Geographies

Click to enlarge

People in Hollywood

Data reflects year-to-date activity through Q2 2026

"People in Hollywood" includes visits from any pedestrian who lives, works, visits, or passes through the Hollywood Entertainment District for more than 10 minutes at a time. If you spend time here on a typical day, your visit(s) count in this data.

Every day, a diverse mix of residents, workers, and visitors brings Hollywood to life. This section provides a snapshot of who is here, when they are here, and how they interact with the district. Together, these insights across population patterns, generational and demographic makeup, long-term visitation, and pedestrian activity reveal the daily and seasonal rhythms that define Hollywood.


Total People and Total Domestic Tourists are Placer.ai visit counts, as are the share of daily population, average household income, busiest days and busiest times shown on every card. Those are measured inside the HED PBID boundary and reflect domestic visitors only.

Total Workers, Total Residents and every per-square-mile figure come from ESRI Business Analyst census data, measured across the HED Value of Downtowns boundary — a larger footprint than the PBID. Counts of people and counts of visits are therefore drawn from different areas and are not directly comparable: the workers and residents totals describe who is based in the wider district, while the visit figures describe activity inside the PBID.

People in HED
9.8M
Total People
▲ +4.4% YOY
108KPeople Daily
72KPer Sq Mile
$107KAvg. HH Income
Fri–SunBusiest Days
6PM–10PMBusiest Time
Workers in HED
30.4K
Total Workers
▼ −5.9% YOY
12%Share of Daily Pop
21.7KPer Sq Mile
$122KAvg. HH Income
Tue–ThuBusiest Days
11AM–3PMBusiest Time
Residents in HED
30.7K
Total Residents
▼ −0.3% YOY
9%Resident Share
21.8KPer Sq Mile
$101KAvg. HH Income
Mon–ThuBusiest Days
11PM–6AMBusiest Time
Domestic Tourists in HED
7.7M
Total Domestic Tourists
▲ +4.1% YOY
79%Tourist Share
55.2KPer Sq Mile
$140KAvg. HH Income
Fri–SunBusiest Days
6PM–10PMBusiest Time

People in the HED by Generation

Key Insight

Millennials and Gen Z together represent 65% of HED daily users — Hollywood's entertainment and cultural offering resonates strongly with younger urban audiences.

Click to expand ↗

People in the HED by Race & Ethnicity (Residents & Workers Only)

Key Insight

Hollywood's daily visitor base is notably diverse — Latinx and White visitors each account for roughly 40% of traffic, reflecting the district's regional and global draw.

Click to expand ↗

—

Key Insight

—

Pedestrian Counts

Data reflects weekly and monthly activity through Q2 2026

This data shows how pedestrian activity moves through the Hollywood Entertainment District, highlighting daily rhythms, seasonal patterns, and the significant impact of major events on street-level activity over time.


Peds by the Numbers

Year to Date

Jan – Jun 2026

18.8M

Total People

+5.3% vs Jan – Jun 2025

Q2 2026

Apr – Jun 2026

9.8M

Total People

+4.4% vs Q2 2025

Latest Week

Week of 9/6–9/12/2026

733.0K

Total People

+29.0% vs comparable week 2025

* Visitor counts are gathered using Placer.ai's Market Population Trends methodology, applied identically to the Hollywood Entertainment District, Greater Hollywood and the Walk of Fame. Figures reflect domestic visitors only — international visitors are not captured, so actual visitation is higher than shown. The Walk of Fame market was established in 2026 and does not yet have a full year of history, so year-over-year comparisons are not shown for it. Data can be delayed up to 2–3 weeks.

Weekly Activity

Pedestrian Counts by Day of Week

Daily breakdown of tourist, worker, and resident activity patterns across the week of 9/6–9/12/2026 compared to the same week in 2025 and 2019.

Daily Breakdown by People Type

Compare Year

Tourists Workers Residents
Key Insight

Monthly Activity

Pedestrian Counts by Month

Month-by-month totals comparing 2026, 2025, and 2024 for the Hollywood Entertainment District.

Key Insight

Q2 2026 totaled 9.79M, up 4.4% from Q2 2025, and every month grew. April rose 4.6% and May 1.5%, and June — with LA Pride and the opening of the FIFA World Cup — was the quarter’s busiest month at 3.34M, up 7.2% year over year.

Pedestrian Trends

Weekends Drive Volume

Friday through Sunday consistently accounts for the majority of weekly pedestrian traffic, with Saturday peaking at 128.5K — more than 40% above the typical weekday baseline.

Tourist Activity Leads

Tourists represent the dominant pedestrian segment throughout the week, peaking on weekends. Worker and resident activity provides a stable weekday baseline.

Summer & Fall Peak Seasonality

July and October consistently rank among the highest-traffic months of the year, driven by summer tourism and fall event programming. February is the softest month district-wide.

Event Day Impact

Hollywood peaks on major event days

Typical days maintain a steady baseline, while major cultural moments consistently drive the district's highest pedestrian volumes.

  • Typical Weekday92K
  • Typical Weekend127K
  • High-Attendance Days Top 5%138K
  • Peak Day LA Pride156K

Examples of High-Attendance Event Days

Top 5%

LA Pride

2023–2025

133K–156K

Top 5%

Halloween Weekends

2023–2025

138K–151K

Top 5%

Major Hollywood Blvd Concerts

2023–2025

129K–135K

Methodology: Typical weekday baseline represents Monday–Thursday averages excluding holidays and major events. High-attendance days represent the top 5% of all measured days across 2023–2025. The single highest day aligns with LA Pride.

Hollywood at a Glance

Data reflects year-to-date activity through Q2 2026

This snapshot pulls together key indicators across Hollywood's business, residential, hotel, retail, and visitor economy — offering a quick pulse check on how the district is performing today.


Working
2,977

Total Businesses in HED

4.9M sq ft

Office Space in HED

30.4K

Workers in HED

19

Office Projects in Development


Living
7.6K

Total Multifamily Units in HED

$2.8K

Avg. Monthly Asking Rent

30.7K

Residents in HED

59

Multifamily Projects in Development


Visiting
3,031

Total Hotel Rooms in HED

$239.14

Avg. Daily Room Rate (HED)

7.7M

Domestic Tourists in HED

8

Hotel Projects in Development


Retail
3.1M sq ft

Retail Space in HED

$3.11 PSF

Monthly Retail Rent

45

Retail Projects in Development

$124K

Avg. Tourist Household Income

Showcasing Hollywood

Hollywood's Entertainment District is the heartbeat of the global entertainment industry, home to hundreds of Walk of Fame stars, historic theatres, and world-famous red carpet events. From the Oscars to LA Pride, the district continues to attract audiences, talent, and investment from around the world.

2,800+

Stars on the Walk of Fame

30+

Theatres

20,000+

Theatre Seats

50+

Red Carpet Events Annually


Optimal Urban Mix

Research from Cushman & Wakefield and the Places Platform shows that the ideal balance for thriving real estate markets is 42% Work, 32% Live, and 26% Play. This mix drives the highest real estate value and GDP per acre, fostering vibrant and resilient urban districts. The Hollywood Entertainment District already outperforms many downtowns that remain overly reliant on office use.

Printable Snapshot

A two-page summary of the quarter — foot traffic, who is here, market conditions, the development pipeline and the five key takeaways. Print it or save it as a PDF to share.

Page 1 · the numbers  •  Page 2 · the takeaways

HollywoodMarket Moves
The Hollywood Partnership
Q2 2026 · Quarterly Market Report
Data through June 30, 2026
hollywoodpartnership.com

Hollywood’s strength as a destination is carrying the district while the workday recovers more slowly. Hotels beat the nation, retail tightened against a flat national market, and the office market has not yet turned.

Foot traffic

9.8M
People in Q2
▲ 4.4% vs Q2 2025
108K
People per day
Avg. stay 2.4 hrs
18.8M
Year to date
▲ 5.3% vs 2025
3.34M
June — busiest month
▲ 7.2% vs June 2025

Mix of visits: 79% visitors · 12% workers · 9% residents. Visitors 7.7M (▲4.1%), worker visits 1.17M (▼2.8%), resident visits 912K (▲18.4%). Greater Hollywood drew 23.8M people (▲5.7%); the Walk of Fame, a new Placer market this year, drew 4.2M.

Who is here

Workers

  • Workers in the HED 30.4K
  • Businesses 2,977
  • Avg. household income $122K
  • Professional & technical jobs 26%
  • Creative-sector jobs 17.6%
  • Live within 10 miles 56%

Residents

  • Residents in the HED 30.7K
  • Median age 37.5
  • Avg. household income $101K
  • Renter-occupied 96%
  • Bachelor’s degree or higher 53%
  • Walk Score 95

Visitors

  • Domestic visitors in Q2 7.7M
  • Average stay 2.4 hrs
  • Avg. household income $140K
  • From households $150K+ 30%
  • Top source states TX · NY
  • Busiest days Fri–Sun

Market conditions

Office

  • Inventory 4.9M SF
  • Vacancy 21.1%
  • Avg. asking rent $4.53
  • Class A vacancy 16.8%
  • Class A asking rent $5.46
  • Net absorption −26,294 SF

Multifamily

  • Units 7.6K
  • Vacancy 8.1%
  • Avg. asking rent $2.8K
  • 5-Star rent $4,522
  • 1–2 Star rent $1,504
  • Cap rate (YTD) 5.0%

Retail

  • Inventory 3.1M SF
  • Vacancy 6.2%
  • Avg. asking rent (NNN) $3.11
  • Rent change ▲ 5.7%
  • Net absorption +21,443 SF
  • Premium vacancy 5.7%

Hotel

  • Rooms · hotels 3,031 · 17
  • Occupancy 74.7%
  • ADR $239.14
  • RevPAR $178.61
  • Room revenue $49.3M
  • RevPAR change ▲ 13.3%

Development pipeline

19
Office projects
1.9M SF in the HED
59
Multifamily projects
4.3K units in the HED
8
Hotel projects
925 rooms in the HED
45
Retail projects
347.2K SF in the HED
Hollywood Entertainment District. Sources: Placer.ai (Market Population Trends, domestic visitors only), CoStar, Cushman & Wakefield, STR, ESRI Business Analyst, LEHD, The Hollywood Partnership. Office and retail rents are monthly per square foot. hollywoodpartnership.com
Key TakeawaysQ2 2026
The Hollywood Partnership
Hollywood Entertainment District
April – June 2026
hollywoodpartnership.com
+13.3%
RevPAR growth

Hospitality outperformed the nation

Hollywood hotels grew RevPAR 13.3% against 5.7% nationally — and unlike the national market, gained occupancy and room rate together rather than rate alone. Greater Hollywood room demand rose while Greater Los Angeles lost demand.

+18.4%
Resident visits

A neighborhood, not just a destination

Resident visits rose sharply while worker visits declined. More than 30,000 residents now anchor the district’s daily rhythm, shifting activity toward evenings and weekends and supporting retail, restaurants and services beyond visitor demand.

16.8%
Class A vacancy

Quality continues to win

Class A office vacancy stands at 16.8% against 21.1% market-wide, and nine points below the Greater Los Angeles Class A rate. Premium retail vacancy is 5.7% versus 6.3% for everything else. Where Hollywood offers the best product, it holds the strongest demand.

6.2%
Retail vacancy

Retail is tightening

Retail vacancy fell two full points while the national rate held flat, asking rents rose 5.7% against 2.4% nationally, and net absorption was positive for a third consecutive quarter. Hollywood is now the tightest of the three retail markets tracked.

5
Negative quarters

The office market has not yet turned

Vacancy rose again and absorption was negative for a fifth consecutive quarter, even as national office vacancy declined. Hollywood still runs more than two points below the citywide rate and its contraction is far shallower than the region’s, but the recovery has not yet reached the district.

How Hollywood compares

MeasureHollywoodUnited StatesGreater Los Angeles
Hotel RevPAR growth▲ 13.3%▲ 5.7%—
Hotel occupancy74.7%—72.9%
Retail rent growth▲ 5.7%▲ 2.4%▼ 3.6% (City of LA)
Retail vacancy6.2%6.0%6.6% (City of LA)
Office vacancy21.1%20.1%23.4%
Office vacancy, Class A16.8%—25.9%
Office net absorption−26,294 SF−360,000 SF−372,185 SF
About the data. Visitor counts use Placer.ai’s Market Population Trends methodology and reflect domestic visitors only; international visitors are not captured, so actual visitation is higher than shown. Office figures are Cushman & Wakefield’s Hollywood submarket; retail and multifamily are CoStar for the HED; hotel figures are STR for the HED. Demographics are ESRI Business Analyst. Development counts are maintained by The Hollywood Partnership. Full dashboard: hollywoodpartnership.com/do-business/market-moves-dashboard-q2-2026

Snapshot Data Sources: CoStar, Cushman & Wakefield, ESRI Business Analyst, Placer.ai, The Hollywood Partnership, Urbanize LA, US Census, ZIMAS

WORKING IN HOLLYWOOD

At its core, Hollywood is a hub of creativity and storytelling. Anchored by a powerful entertainment production ecosystem and a globally recognized name, the district blends laid-back Southern California culture with the drive and innovation that define the industry. While Hollywood remains a center for film, television, and music production, its employment base is broad and diverse, supporting a wide range of sectors that contribute to the district's economic strength.

Data Geographies

Click to enlarge

Workforce & Business Landscape

Data reflects year-to-date activity through Q2 2026

A quick view of the employment and industry mix that powers Hollywood, from entertainment and creative production to the wide range of sectors that support the district's daytime economy.


HED Worker Population

30.4K

Total Workers

21.7K
Workers per Sq Mile
13K
Daytime Population
13%
Share of Daytime Population

HED Worker Trends

1.2M

Worker Visits to HED (Q2 2026)

$71K
Worker Median Income
Tue–Thu
Busiest Days
10AM–4PM
Busiest Time

HED Employment Profile

2,977

Total Businesses

26%
Labor Force in Prof. Serv./Tech.
17.6%
Labor Force in Creative Jobs
7%
Unemployment Rate

HED Workers by Race & Ethnicity

Latinx workers represent the largest share at 48%, followed by White at 31% and Asian at 14%.

Click to expand ↗

HED Employment by Industry

Professional & Technical
13%
Information
13%
Accommodation & Food
12%
Arts, Entertainment
10%
Retail
9%
Education Services
7%
Health Care & Social
7%
Finance & Insurance
6%
Construction
6%

Professional & Technical Services and Information each account for 13% of employment, followed by Accommodation & Food at 12% — reflecting Hollywood's entertainment-anchored but broadly diversified economy.

Click to expand ↗

Shifting Work Patterns

Worker visits to the Hollywood Entertainment District remained below pre-pandemic levels in Q2 2026 and were modestly down year over year. These trends continue to reflect evolving workplace patterns across the region, including hybrid work adoption, changing commuting behavior, and broader shifts within the entertainment and office sectors.

Hybrid and flexible work schedules continue to influence weekday pedestrian volumes, with midweek visitation remaining stronger than Mondays and Fridays.

Hollywood's worker data captures a broad mix of employees beyond traditional office workers, including hospitality staff, production crews, service workers, contractors, vendors, and retail employees. Small shifts across these support workforce categories can significantly impact overall worker visitation patterns.

Ongoing adjustments within the entertainment, media, and office sectors likely contributed to lower recurring weekday worker trips throughout the district.

Despite softer worker visitation, increased tourism, nightlife, and entertainment activity helped support overall district foot traffic and street-level activity.

1.2M

Worker Visits to HED

Q2 2026 (1,166,675)

−2.8%

Change vs. Prior Year

Q2 2025

−21%

Of Pre-Pandemic Levels

Q2 2019 Baseline

HED Quarterly Worker Visits Over Time

Worker visits in Q2 2026 totaled 1.17M, down 2.8% from Q2 2025 and 21% below the Q2 2019 pre-pandemic baseline. Placer.ai counts domestic visits only.

Click to expand ↗

HED Worker Jobs by Distance (2023)

Over half of HED workers (56%) commute from less than 10 miles away, with another 26% traveling 10–24 miles — reflecting a predominantly local workforce.

Click to expand ↗

—

Key Insight

—

Office Market Conditions

Data reflects year-to-date activity through Q2 2026

Trends in office supply, leasing activity, and vacancy across Hollywood and the broader market. While national office markets continue to adjust to hybrid work and evolving tenant demand, Hollywood's office landscape reflects a more resilient mix of creative, production, and Class A space relative to citywide conditions.


Overall Office Inventory

4.9M SF

Total Hollywood Office Space

Overall Avg. Monthly Asking Rent

$4.53 PSF

Per Square Foot Per Month

Overall Vacancy

21.1%

Hollywood Overall Vacancy Rate

Premium Tier

Class A Performance

Inventory

3.3M SF

66% of total market

Avg. Monthly Asking Rent

$5.46 PSF

≈ 21% premium vs overall

Vacancy

16.8%

≈ 4.3pp better than overall

Class A space continues to command premium rents while maintaining lower vacancy — an indicator of stronger-performing office product.

Overall Market

Comparative benchmarks

HWD Overall Avg. Monthly Asking Rent (Q2 2026)

$4.53 PSF

Change from Q1 2026↑ +0.4%
Change from Q2 2025↑ +1.8%
Compared to Citywide↑ +23%

HWD Overall Vacancy Rate (Q2 2026)

21.1%

Change from Q1 2026↑ +0.5pp
Change from Q2 2025↑ +4.7pp
Compared to Citywide↓ −2.3pp

Class A Tier

Comparative benchmarks

HWD Class A Avg. Monthly Asking Rent (Q2 2026)

$5.46 PSF

Change from Q1 2026↓ −0.2%
Change from Q2 2025↑ +6.4%
Compared to Citywide↑ +37%

HWD Class A Vacancy Rate (Q2 2026)

16.8%

Change from Q1 2026↑ +0.8pp
Change from Q2 2025↑ +3.7pp
Compared to Citywide↓ −9.1pp

In office markets, rising rents typically reflect stronger demand, while falling vacancy rates indicate healthier absorption. The arrows and colors are calibrated to show these as positive movements.

Overall Vacancy Rates By Quarter

Hollywood's overall vacancy rose to 21.1% in Q2 2026 — up 4.7pp from Q2 2025 and 0.5pp from Q1, but still 2.3pp below the citywide rate of 23.4%.

Click to expand ↗

Class A Vacancy Rates By Quarter

Class A vacancy rose to 16.8% in Q2 2026 — up 3.7pp year over year, but still 9.1pp below Greater LA's 25.9%. Hollywood's premium tier is softening from a strong position.

Click to expand ↗

Regional Overall Office Vacancy Rates Over Time

Hollywood's 21.1% vacancy in Q2 2026 sits below Downtown CBD (32.3%), Downtown Non-CBD (31.8%), LA West (22.7%) and Greater LA (23.4%), and above LA North (19.1%) and LA South (20.9%).

Click to expand ↗

Annual Avg. Asking Rents (PSF) Over Time

Hollywood's annual avg. asking rent rose to $54.36 PSF in Q2 2026, up from $54.12 in Q1 2026. Hollywood remains second only to LA West ($60.00) among LA submarkets.

Click to expand ↗

Net Absorption

Quarterly Change in Occupied Office Space

Net absorption tracks how much office space becomes newly occupied versus newly vacated each quarter. Positive values indicate growing demand, while negative values reflect contraction. In recent quarters, Hollywood's net absorption has turned negative, though declines remain less pronounced than those seen across the broader Los Angeles office market.


Q2 2026 · Quarterly

−26,294 SF

Net Move-Out · YTD −57,200 SF

Momentum

The last 5 quarters negative

Recent Trend

Relative Performance

Hollywood declines are less severe than Greater LA

Market Comparison

Hollywood Quarterly Net Absorption

Q2 2026 net absorption was −26,294 SF, a slight improvement on Q1 2026's −30,906 SF. Hollywood has now recorded five consecutive quarters of negative absorption, bringing year-to-date net absorption to −57,200 SF.

Click to expand ↗

Hollywood & Citywide Quarterly Net Absorption

Hollywood's declines remain consistently less severe than Greater LA's. While Greater LA recorded −372,185 SF in Q2 2026, Hollywood's −26,294 SF reflects a far more contained contraction.

Click to expand ↗

—

Key Insight

—

Top Stories

Echelon Studios Hollywood at 5601 West Santa Monica Boulevard

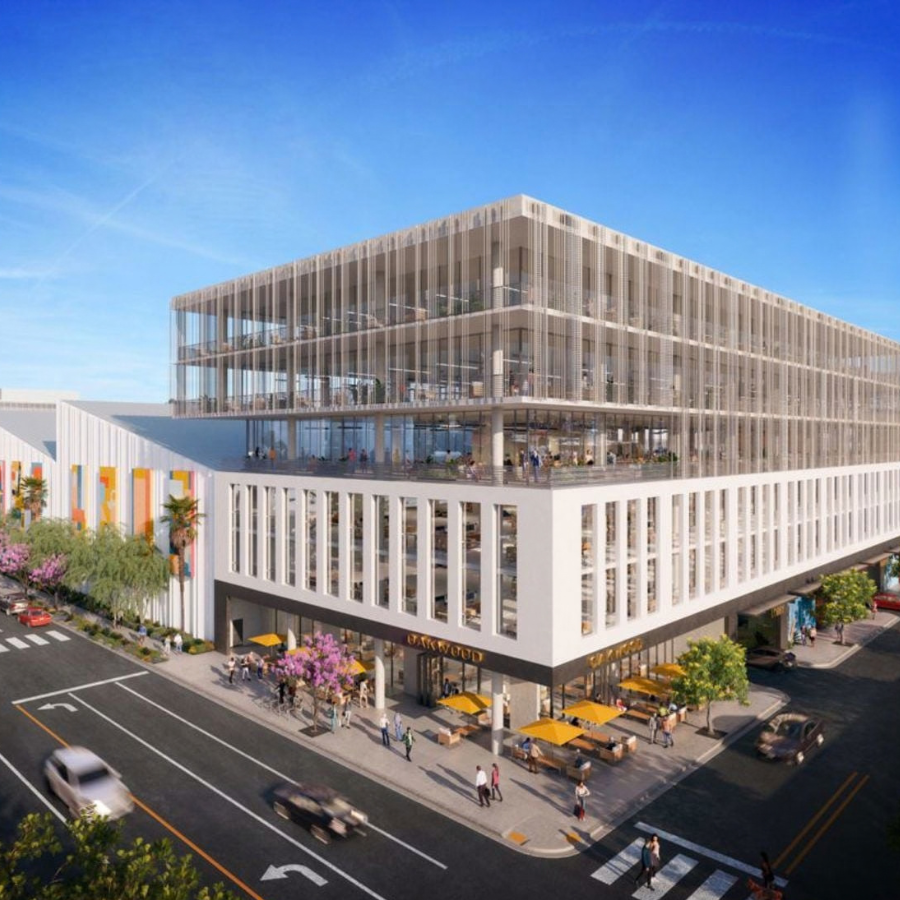
Echelon Studios Hollywood Tops Out (Q2 2026)

Construction reached a major milestone in June at Echelon Studios Hollywood, the new production and creative office campus at 5601 W. Santa Monica Boulevard. The more than 500,000-square-foot development will include approximately 388,000 square feet of office space, 110,000 square feet of production studios and support space, and more than 12,300 square feet of ground-floor restaurant space. The full-block project from Bardas Investment Group and Bain Capital Real Estate is expected to be completed in winter 2026, adding significant new creative workspace and production capacity to Hollywood.

Source: Urbanize LA

Prebuilt standing set at Sunset Las Palmas Studios

Sunset Las Palmas Looks to Short-Form Production (Q2 2026)

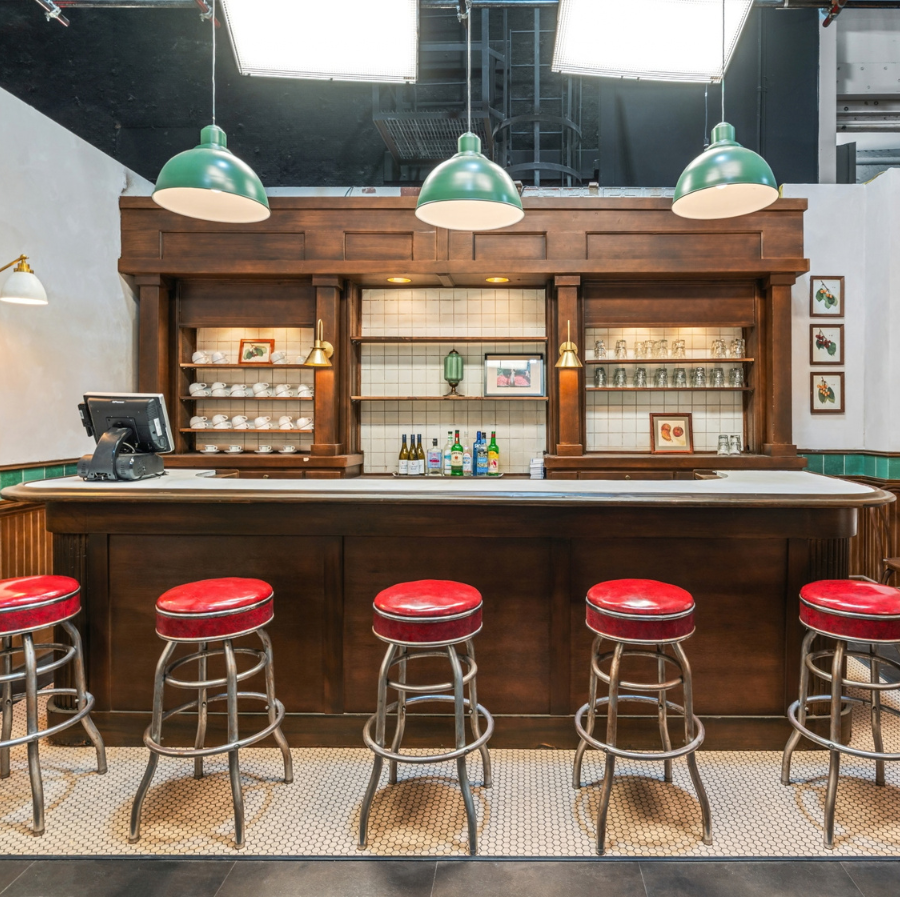
As Los Angeles’ production industry continues to evolve, Sunset Studios is introducing a new model at its historic Sunset Las Palmas lot in Hollywood. The studio has created prebuilt, camera-ready sets designed to attract fast-turn short-form and mobile-first productions, including courtroom, apartment, hospital, office, bar and restaurant environments. Developed with Los Angeles-based production company Knockout Shorts, the new setup occupies an 8,000-square-foot soundstage and is designed to reduce the time and cost required to get productions up and running. The move reflects an effort to attract emerging forms of content production and keep more production activity in Los Angeles as traditional soundstage demand remains below its peak.

Source: CoStar News

Crowds along a Hollywood red carpet

Hollywood Is Open for Business: Global Brands Are Making the District Home (Q2 2026)

Hollywood isn’t just where the world comes to visit; it’s where global brands come to work. With nearly 3,000 businesses and 29,000 employees in the Hollywood Entertainment District (55K employees in Greater Hollywood), the neighborhood has become one of LA’s most sought-after headquarters destinations. Netflix anchors the district’s creative identity, while Kim Kardashian’s Skims claimed 116K SF at 1601 Vine for its flagship HQ. Puma opened a Hollywood creative studio in 2025 to tap into the neighborhood’s unmatched cultural influence. Hasbro is relocating its entire media-and-entertainment division, spanning film, TV, gaming, and AI, to the nearby WeHo Lot at Formosa by Q1 2027. The Entertainment Fund, Com2uS, Capitol Records, Universal Music Group, Live Nation, Sunset Studios, Goldenvoice, Framework, Edelman, Insomniac Events, Verve Talent Agency, Outfront Media, BLT Communications, 12 05 AM Productions, Jimmy Kimmel Live!, and Paramount round out a roster that reads like a who’s who of entertainment, media, and consumer brands. Hollywood isn’t just an address — it’s a statement.

Columbia Square on Sunset Boulevard

Fitler Club Inks Long-Term Lease at Kilroy’s Columbia Square (Q1 2026)

Kilroy Realty has quickly backfilled Hollywood’s former NeueHouse space, signing Philadelphia-based Fitler Club to a long-term lease at Columbia Square, 6121 W. Sunset Blvd. The 93,000-square-foot deal brings a members-only coworking and social club back to the historic campus just months after NeueHouse’s national closing. Fitler Club, which opened its 100,000-square-foot flagship in Philadelphia in 2019, blends workspace with dining, events, and hospitality-driven amenities designed to feel more like an upscale hotel than a traditional office. Its Hollywood location marks the brand’s first expansion and taps into Los Angeles’ growing ecosystem of private clubs and “third spaces,” positioning Columbia Square to remain a magnet for creative, media, and entertainment professionals seeking premium, curated environments.

Sunset Media Center tower on Sunset Boulevard

Sunset Media Center Sold for $61M (Q4 2025)

Joint venture partners Hankey Investment Co. and Barker Pacific Group have scooped up Hollywood’s Sunset Media Center from Kilroy Realty for $61 million, or about $187 per square foot, well below L.A. County’s roughly $329-per-foot office average as of late 2025. The 22‑story, 325,995 SF Class A tower at 6255 Sunset Blvd. is just 51% leased, with tenants including OpenTable, giving the buyers a value‑add lease‑up play. Hankey, which also funded the debt, and Barker Pacific say they plan aggressive marketing and “attractive leasing package economics,” but will take a long‑term view, targeting select deals this year rather than a rapid flip. The 1974‑vintage building underwent a multimillion‑dollar renovation in 2014; ownership is weighing additional interior upgrades while retaining JLL’s leasing team to continue leasing efforts at the high‑profile asset. “We are ready to write Sunset Media Center’s next chapter in the heart of Hollywood,” said Scott Dobbins, president of HIC.

Lounge inside Spotify’s Hollywood podcast studio

Spotify Brings Podcast Studio to Hollywood (Q4 2025)

Spotify is deepening its Hollywood footprint with a new, invitation-only podcast studio in the Sycamore media district, just steps from Roc Nation, SiriusXM and Sony Music. The nearly 11,000‑square‑foot facility, the streamer’s second Los Angeles location, is purpose‑built for video podcasts, underscoring how quickly the medium is evolving beyond audio. The site houses five fully outfitted studios and a dedicated Spotify production staff, providing talent with a turnkey venue for developing premium, multi-platform franchises. The investment aligns with Spotify’s broader podcast strategy and comes as the company expands distribution for its flagship partner, The Ringer, whose video podcasts are slated to stream on Netflix later this year. By staking a claim in Sycamore, Spotify signals its intent to ultimately compete directly with established Hollywood players for creators, ad dollars and global cultural impact.

Chaplin Recording Studios logo

$44M Investment in Chaplin Studios (2025)

In one of Hollywood’s most closely watched studio trades, musician John Mayer and director McG have acquired the historic Jim Henson Company Lot at 1416 N. La Brea Ave. The three-acre property, originally built by Charlie Chaplin and later known as A&M and Henson Studios, was sold in late 2025 for approximately $44 million as the Henson family consolidates operations in Burbank. Long a recording hub for artists from Carole King and Joni Mitchell to Guns N’ Roses and D’Angelo, the campus has now been renamed Chaplin Studios. Mayer, already a tenant on the lot, and McG plan to preserve its legacy while repositioning it as a collaborative, Warhol’s-Factory-style creative compound for music and film. Industry reaction has been positive, with clients such as Paul McCartney praising the sensitive stewardship.

Entrance to a Hollywood office building

Significant Sales & Leases (2025)

Sales:

  • 1601 Vine St: Kingsbarn Realty, $105 Million (115K SF)
  • 6255 Sunset Blvd: Hankey & Barker, $61 Million (325K SF)
  • 7060 Hollywood Blvd: RCB Equities, $32 Million (178K SF)
  • 5802-5806 Willoughby Ave: $6.15 Million (9,500 SF)
  • 923 Cole Ave: $3.5 Million (6,250 SF)
  • 905 Cole Ave: $3.6 Million (5,000 SF)

Leases:

  • BLT Communications Lease, 6430 Sunset Blvd (14,161 SF)
  • Undisclosed 60-Month Lease, 6344 Fountain (9,008 SF)
  • Mount Saint Mary's University 99-Month Lease, 6922 Hollywood Blvd (8,756 SF)
  • Instinctual LLC 39-Month Lease, 1017 Cole Ave (4,311 SF)
  • Afokiko 12-Month Lease, 6535 Santa Monica Blvd (2,975 SF)
  • Verve Talent & Literary Agency 9-Year Lease, 6555 Barton Ave (25,056 SF)
Hollywood Arts Collective building

Entertainment Community Fund Moves to Hollywood (Q2 2025)

Designed to foster belonging and community resilience, the new office expands the organization’s reach and ability to offer vital resources and support to arts and entertainment professionals. With a dedicated entrance on Schrader Boulevard just off Hollywood Boulevard, the multi-level 12,000 square-foot interior office fit-out was designed by HGA to serve as a home base for the West Coast operations of the national human services organization. The new offices anchor the residential component of the two-building Hollywood Arts Collective, a broader development initiative aimed at expanding access to affordable spaces for artists to live, work and create in the heart of Hollywood. With a new, purpose-built regional home base, the Entertainment Community Fund can now more comprehensively deliver the critical services and resources that help creative professionals stay and thrive in the local area.

The glass office building at 1601 Vine

1601 Vine Office Building Sells for $105 Million (Q1 2025)

Kingsbarn Realty Capital, a Las Vegas-based investor, purchased the Skims headquarters building (former WeWork Building) at 1601 Vine from JH Snyder for $105 million, or $908 per square foot. The building comprises 115,000 square feet of office space, with five levels of underground parking. It is only the fourth sale to exceed $100 million in Los Angeles over the past two years, with the per-square-foot price at nearly triple the area average. Kingsbarn Chief Executive Officer, Jeff Pori, stated, “The combination of the location at Hollywood and Vine, the magnificent design, the perfect Hollywood tenant, and the long-term lease, makes for a winning investment opportunity.” The Skims office headquarters is leased in that location, occupying almost all the floors in the building, through 2038, showing the long-term value of a physical workspace.

PUMA Studio LA at 6345 Fountain Avenue

PUMA Studio LA Opens in Hollywood (Q1 2025)

PUMA opened PUMA Studio LA in early 2025, a new 23K SF creative office at Bardas Investment Group’s 6345 Fountain Ave in Hollywood, directly across from Netflix. Serving as a West Coast hub for product, design, and marketing teams, the studio is a key part of PUMA’s strategy to grow its US business and get closer to influential creative communities, celebrities, and brand ambassadors. Designed as a collaborative space to bring ideas from concept to market, PUMA Studio LA also features a bespoke VIP area showcasing upcoming products. The new office strengthens its footprint in a globally recognized center of storytelling and culture. “For companies where brand visibility is really important, there is a trend of creating spaces that don't just function as offices. The office is a creation hub,” said real estate broker Nicole Mihalka of CBRE.

Working Data Sources: CoStar, Cushman & Wakefield, ESRI Business Analyst, Placer.ai, The Hollywood Partnership, US Census

LIVING IN HOLLYWOOD

Hollywood's residential landscape reflects the energy and complexity of the district itself. With a dense, renter-dominated population drawn by proximity to work, culture, and entertainment, the neighborhood commands rent premiums while facing real affordability pressures. This section explores who lives here, what they pay, and how the multifamily market is evolving.

Data Geographies

Click to enlarge

Resident Profile & Behaviors

Data reflects year-to-date activity through Q2 2026

A closer look at who lives in Hollywood today, examining resident demographics, household composition, and everyday behaviors that shape how people live, move, and engage within the district.


HED Resident Population

30.7K

Total Residents

21.8K
Population Density
Mon, Tue, Wed
Busiest Days
5:00PM–10:00AM
Busiest Time

HED Households (HHs)

17.7K

Total Households

96%
Renter Occupied
1.6
Average Household Size
$61K
Med. Household Income

HED Resident Demos

37.5

Median Resident Age

53%
Bachelor's Degree or Higher
61%
Associate's Degree or Higher
64%
Never Married

Residents By Generation

Millennials lead Hollywood's resident base at 42%, followed by Gen Z at 22% and Gen X at 17%. Together, Millennials and Gen Z make up 64% of residents — reflecting a young, urban-oriented population.

Click to expand ↗

Residents By Race & Ethnicity

Hollywood's residential population is notably diverse, with White residents at 46% and Latinx at 36%, followed by Asian at 9% and Black at 9%. The Diversity Index of 84.4 ranks Hollywood among the most diverse neighborhoods in LA.

Click to expand ↗
84.4
DIVERSITY INDEX

Hollywood Residential Diversity Index

The Diversity Index (DI) captures the range and balance of demographic groups in Hollywood's residential community. A score of 84.4 reflects a highly diverse neighborhood, with higher scores indicating greater demographic balance across race and ethnicity.

Resident Commute & Walk Score

Commute Mode Share — HED vs Los Angeles

🚶

95

Walk Score

Walk Score rates how walkable a neighborhood is based on access to everyday amenities. A score of 95 makes Hollywood one of LA's most walkable neighborhoods, offering convenient access to work, shops, transit, parks, and services without relying on a car.

Source: How Walk Score Works

Residential Population Change

Hollywood's HED showed strong population growth of approximately 20% from 2010 to 2025, outpacing Greater Hollywood, LA City, and the region — reflecting continued demand for urban living in the district.

Click to expand ↗

Residential Density Comparison

Hollywood's residential density of 22,000 persons per square mile places it on par with major national urban districts — and well above all other LA-area submarkets.

Click to expand ↗

—

Key Insight

—

Multifamily Market Conditions

Data reflects year-to-date activity through Q2 2026

Trends in residential supply, demand, and occupancy across Hollywood's multifamily market. Strong renter demand continues to be shaped by density, lifestyle preferences, and limited access to homeownership, while recent development activity and affordability pressures influence leasing performance and vacancy patterns across the district.


HED

7.6K

Total Units

$2.8K
Avg. Monthly Asking Rent
8.1%
Vacancy Rate
5.0%
Cap Rate (YTD)

Greater Hollywood

43.8K

Total Units

$2.4K
Avg. Monthly Asking Rent
7.0%
Vacancy Rate
5.2%
Cap Rate (YTD)

City of LA

529K

Total Units

$2.3K
Avg. Monthly Rental Rate
6.4%
Vacancy Rate
5.2%
Cap Rate (YTD)

County of LA

1.4M

Total Units

$2.3K
Avg. Monthly Rental Rate
5.4%
Vacancy Rate
5.2%
Cap Rate (YTD)

Building Class Breakdown

Averages by Building Class

A closer look at rent, vacancy, inventory, and unit size across each star tier in the HED.

5-Star

★★★★★

$4,522

Avg. Asking Rent

Buildings5
Units1,052
Avg. SF1,075
Vacancy6.7%

4-Star

★★★★

$2,841

Avg. Asking Rent

Buildings21
Units4,347
Avg. SF797
Vacancy9.6%

3-Star

★★★

$1,889

Avg. Asking Rent

Buildings14
Units1,309
Avg. SF585
Vacancy4.5%

1–2 Star

★★

$1,504

Avg. Asking Rent

Buildings25
Units1,046
Avg. SF523
Vacancy10.6%
Quality & Vacancy Tension

4-star units still dominate HED at 56% of inventory, and their vacancy eased to 9.6% this quarter. The tension has shifted, though: 1–2 star vacancy jumped to 10.6% — now the highest of any tier — while 3-star product held the tightest at just 4.5%.

Source: CoStar (Q2 2026)


Inventory & Pricing

Star Rating Breakdown

How Hollywood's multifamily inventory is distributed across star tiers — and what each tier rents for on average.

Share of HED Multifamily Units by Star Rating

4-star properties dominate Hollywood's multifamily stock at 56% of all units. Limited affordable 1-2 star inventory at just 13% reflects a market that tilts toward mid-to-upper tier product.

Click to expand ↗

Average Monthly Asking Rent by Star Rating

5-star units command $4,522/month — 3.0x the 1-2 star rate of $1,504. The jump from 4-star ($2,841) to 5-star ($4,522) remains steep, reflecting Hollywood's premium luxury tier.

Click to expand ↗
🏠

$981,132

HED Median Home Value

HED
$981K
National
$410K
↑ 139% Higher than National Average
💰

$61.2K

HED Median HH Income

HED
$61.2K
National
$83.7K
↓ 27% Lower than National Average
🏦

25

Housing Affordability Index

The Housing Affordability Index (HAI) shows whether a typical family earns enough to afford a median-priced home. A score of 100 means they earn exactly what's required. Scores above 100 reflect higher affordability; scores below 100 reflect lower affordability.

💵

$245K

HH Income Needed to Buy in HED

A family earning the current HED Median HH Income would need to earn four times more to comfortably afford the median-priced home.

Resident Retention

Data reflects year-to-date activity through Q2 2026

Hollywood supports a strong mix of housing options, but long-term neighborhood stability depends on whether residents can stay as their needs change — especially in a renter-dominant community. This section frames retention around affordability pressure, unit mix, and the importance of new housing supply across price points and sizes.


Avg Monthly Asking Rent

$2.8K

Baseline cost of staying in the district

Median Household Income

$61.2K

Proxy for affordability capacity

Renter-Occupied

96%

Retention is primarily a rental story

Retention Tier

Affordability & Life-Stage Fit

Income Needed (30% Rule)

$112K

Estimated income to afford $2.8K/month

Avg Household Size

1.6

Signals studio / 1BR dominance

Retention Risk

High

Households spending 30%+ of income on rent are most likely to relocate

Retention takeaway: Expanding supply across price points and unit sizes helps residents stay in Hollywood as they grow — reducing life-stage displacement.

What Improves Retention

Housing pathways that keep residents local

Supply Strategy

More "middle" rents↑
More 2BR / family options↑
More "right-size" options (1BR→2BR transitions)↑
Stability-oriented supply (longer tenures / fewer forced moves)↑

A thriving neighborhood isn't one perfect demographic — it's balance and pathways that let residents stay through life changes.

—

Key Insight

—

Top Stories

Sophia Hollywood apartments at 1759 North Gower Street

Sophia Hollywood Sale Sets a New Multifamily Benchmark (Q2 2026)

Investor interest in Hollywood multifamily showed a strong signal in Q2 with the sale of Sophia Hollywood, a 28-unit Class A apartment community at 1759 N. Gower Street. The property sold in May for approximately $16 million, marking the highest price per unit for a Hollywood multifamily sale in more than three years. Colliers, which represented the seller, pointed to the transaction as part of growing investor interest in newer Los Angeles multifamily assets as current market conditions create opportunities to acquire properties at costs that can be difficult to replicate through new construction.

Source: Colliers

Rendering of the mixed-use development at 6000 Hollywood Boulevard

6000 Hollywood Boulevard Moves Forward (Q2 2026)

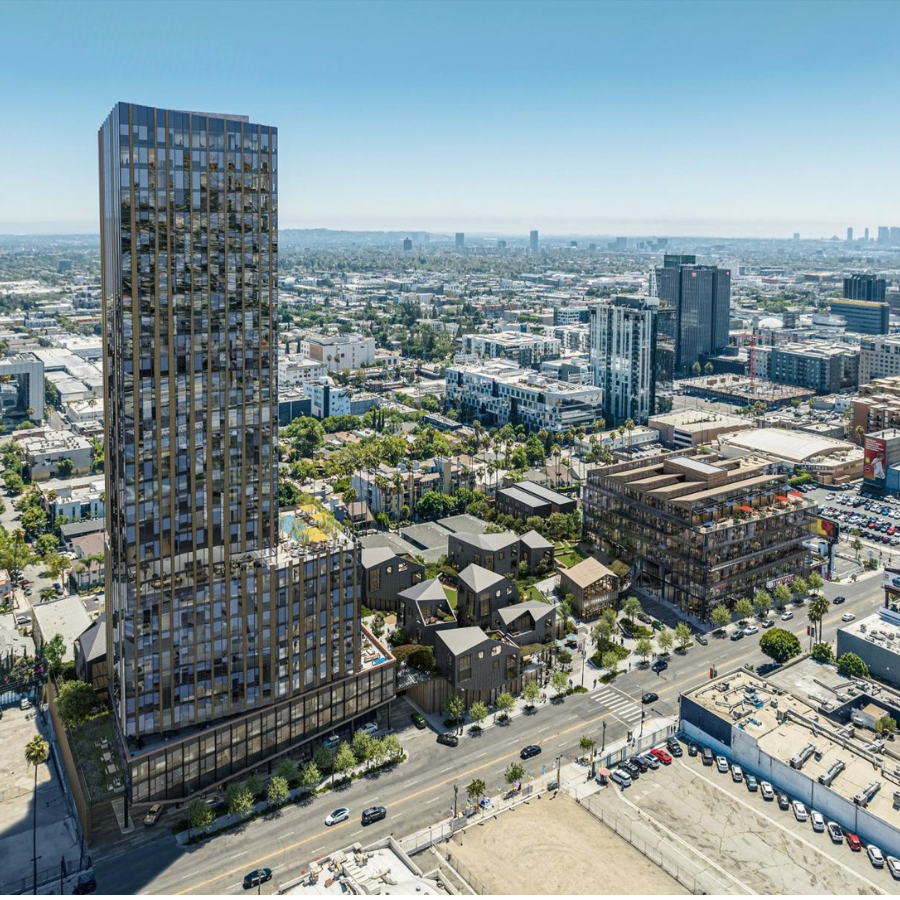
A major mixed-use development at 6000 Hollywood Boulevard reached another milestone in Q2, with the City filing a Notice of Determination for the project in April. Plans call for 350 new homes, including 44 reserved for very-low-income households, alongside 136,000 square feet of office space, approximately 18,000 square feet of retail and 4,000 square feet of restaurant space. The 3.7-acre development would include a 35-story residential tower, a six-story office and retail building, additional residential buildings and low-rise structures along Hollywood Boulevard and Carlton Way.

Living room with a view in a Hollywood apartment

Multifamily Milestone Sales (Q1–Q2 2026)

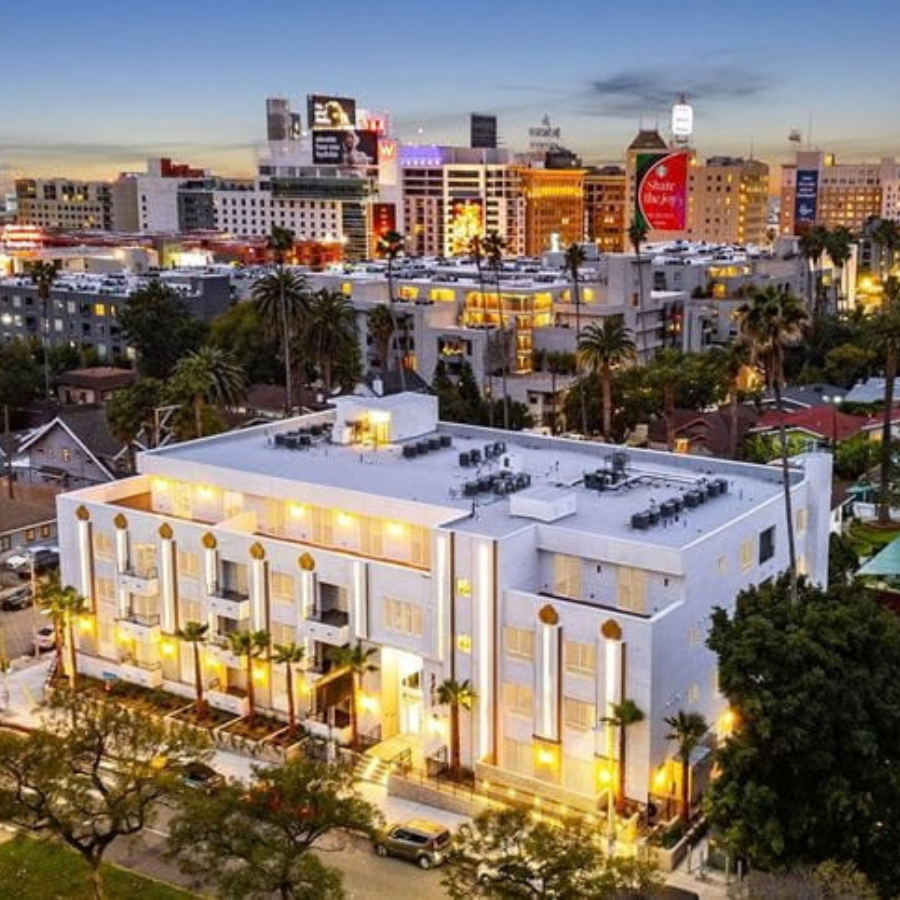
A 28-unit Class A apartment building in Hollywood just sold for $16M, the highest per-unit price in the neighborhood in over three years. Sophia Hollywood, located at 1759 North Gower Street, traded at roughly $571,500 per unit, surpassing a recent benchmark set by the Columbia Square/Jardine portfolio deal (~$514K/unit) and the Ovelo Hollywood sale (~$431K/unit). The sale signals rising investor confidence in Hollywood multifamily, driven by constrained housing supply, elevated construction costs, and strong demand for high-quality infill product. The property's newer construction (completed 2024), condo-quality finishes, and larger floor plans were key draws, even as the sale price came in below replacement cost. As Colliers' Kitty Wallace put it, buyers increasingly recognize that well-located, high-quality housing “will continue to be difficult to build and increasingly valuable over time.”

Rendering of the 6800 Sunset mixed-use tower

6800 Sunset Mixed-Use Tower Approved (Q1 2026)

A transformative high-rise is one step closer to reshaping Hollywood’s core, with the Los Angeles City Planning Commission voting on Feb. 16, 2026, to approve a 42-story mixed-use tower at 6800 Sunset Blvd., at the heavily trafficked southwest corner of Sunset and Highland. The Galaxy Holding–led project would anchor a large new complex that blends residential and commercial uses, further extending Hollywood’s vertical skyline and intensifying activity along the entertainment corridor. The approval represents a major entitlement milestone but does not yet guarantee a construction start, which will hinge on financing, market conditions and potential appeals. Still, the green light signals continued investor and civic appetite for high-density, transit-adjacent development in Hollywood, even at one of its most congested intersections, and positions 6800 Sunset as a potential flagship asset in the submarket’s next growth cycle.

Rendering of the 6000 Hollywood Boulevard project

6000 Hollywood Blvd Project Moves Forward (Q1 2026)

In Q1 2026, the Los Angeles City Council voted to uphold the approval of the proposal to redevelop Toyota of Hollywood into a mixed-use complex featuring housing and offices. This follows the Q3 2025 vote by the Los Angeles City Planning Commission, which also upheld the project's approval. This project will transform the existing 3.7-acre Toyota of Hollywood dealership (6000 Hollywood Blvd.) into a mixed-use development featuring apartments and offices with incredible views of the iconic Hollywood Sign. The project includes a high-rise residential tower, a residential village, an office building, a public plaza, green space, and retail & dining. The development will also employ sustainable timber building materials.

1600 Vine apartment tower

Sentral Takes on Management of 1600 Vine (Q2 2025)

In June 2025, property management at 1600 Vine changed hands to Sentral, a full-service, Class-A multifamily residential hospitality and property management company. The transition is part of Sentral’s expansion into a broader portfolio of innovative, flexible living communities. 1600 Vine offers 375 units with unique floor plans, including studio, one-bedroom, two-bedroom, and a collection of two-story penthouse apartments. Sentral also recently acquired Reveal Playa Vista in Los Angeles.

Aerial view of Hollywood apartment buildings

Significant Multifamily Sales (2025–2026)

HED Sales:

  • Sophia Hollywood, 1759 Gower St., $16M
  • Columbia Square Living & Jardine Multifamily Properties, $202M
  • The Fontenoy, 1811 Whitley Ave, $8.7M, Concord Capital
  • El Centro Apartments & Bungalows, 6200 Hollywood Blvd, $155.5M, Madison Intl Realty, Big 4 Properties
  • Arrive Hollywood, 6201 Hollywood Blvd, $190.9M, FPA
  • Fusion Encore, 1714 McCadden Pl, $73.9M, Lighthouse Grp
  • Ovelo Hollywood, 1331 Cahuenga, $159M, AEW

Gr. Hollywood Sales:

  • Mansfield Terrace (1318 Mansfield) & Palms View (1229 Mansfield), $22.95M
  • The Fifty Five Fifty, 5550 Hollywood Blvd, $98.4M
  • Franklin Skyline, 6543 Franklin Ave, $8.2M
  • La Belle Hollywood Tower, 6138 Franklin, $52.15M
  • Academy House West, 1321 Sycamore, $13.7M
  • Fleur De Lis Apts, 1825 Whitley, $9.4M
  • The Havenhurst, 1861 Whitley, $9.1M
  • La Mirada Apts, 5757 La Mirada, $3.95M
  • 1301 Mansfield, $3.9M
  • 823 Gower, $3.8M
  • 1936 Whitley, $3.4M
  • 6857 Franklin, $3.1M
Rendering of Hollywood Tower at 1360 Vine Street

Trend Watch: Commercial to Residential (2025)

The residential market is strong in Hollywood. As the office market struggles nationally and locally, projects may begin to consider switching office projects to residential. An increasing number of planned commercial developments are incorporating alternative residential options into their project proposals, recognizing this as a strategic business move. Notable examples include the upcoming “Sunset + Highland” at 6767 Sunset Blvd. and “Hollywood Tower” at 1360 Vine Street. Hollywood is also witnessing the national “office to residential” trend unfold, which will be further bolstered by the City of LA’s new adaptive reuse zoning code taking effect this year. Nationally, office conversions have increased each year for the past decade. Locally, an example of this is the conversion of two floors of commercial space at Lumina Hollywood (5929 Sunset Blvd) into more residential units.

Hollywood street scene

Homelessness Down 49% in Hollywood (2025)

According to the 2025 Los Angeles Homeless Services (LAHSA) Point-in-Time Count, street homelessness in the City of LA is down 17.5% over the past two years, the first time back-to-back decreases have ever been recorded. Mayor Bass’ Inside Safe program and citywide housing investments are driving change. Here in Hollywood, a recently published RAND study reports a 49% drop in unsheltered homelessness, one of the most dramatic improvements across the city. The study credits consistent outreach, housing placements, and encampment resolution efforts. Los Angeles is seeing real momentum in the fight against homelessness—and Hollywood is leading the way. At The Hollywood Partnership (THP), we’re proud to be part of this collaborative progress.

Living Data Sources: CoStar, ESRI Business Analyst, Los Angeles Times, Placer.ai, The Hollywood Partnership, Redfin:Walk Score, Urbanize LA

VISITING HOLLYWOOD

Visiting the Hollywood Entertainment District means stepping into one of Los Angeles' most active tourism hubs. From world-famous landmarks and live entertainment to hotels, dining, and cultural events, the district draws millions of domestic and international visitors each year. This section tracks who visits, how they spend time here, and how the hotel market is performing.

Data Geographies

Click to enlarge

Visitor Profile & Behaviors

Data reflects activity through Q2 2026

Understanding visitor patterns helps illustrate how Hollywood functions as a regional and global destination. These insights highlight differences in frequency, duration, and behavior across locals, regional visitors, and tourists, providing context for how people experience the district throughout the year.

Visitor counts are gathered using Placer.ai's Market Population Trends methodology, applied identically to the Hollywood Entertainment District, Greater Hollywood and the Walk of Fame. Figures reflect domestic visitors only — international visitors are not captured, so actual visitation is higher than shown. The Walk of Fame market was established in 2026 and does not yet have a full year of history, so year-over-year comparisons are not shown for it.


HED

Q2 2026

9.8M

↑ 4.4% YoY

Total People in Q2

108K
Daily People
2.4 Hours
Average Stay
7.7M ↑ 4.1% YoY
Total Tourists
Share of People Types
79% Tourists 12% Workers 9% Residents

Greater Hollywood

Q2 2026

23.8M

↑ 5.7% YoY

Total People in Q2

261K
Daily People
2.6 Hours
Average Stay
15.3M ↑ 7.2% YoY
Total Tourists
Share of People Types
65% Tourists 5% Workers 30% Residents

Walk of Fame

Q2 2026

4.2M

Total People in Q2

46K
Daily People
2.1 Hours
Average Stay
3.5M
Total Tourists
Share of People Types
84% Tourists 9% Workers 7% Residents

HED Tourists by Race & Ethnicity

Key Insight

White (39%) and Latinx (38%) visitors together account for more than three quarters of tourists, with meaningful Asian (15%) and Black (8%) representation reflecting the district's broad regional and global appeal.

Click to expand ↗

HED Tourists by Generation

Key Insight

Millennials lead Hollywood's tourist base at 43%, followed by Gen X at 18%, Boomers at 14% and Gen Z at 12%, with Gen Alpha at 7% and the Greatest Generation at 6% — a mix that points to an established Millennial core alongside a meaningful family-travel segment.

Click to expand ↗

Household Income of Tourists in HED

Key Insight

Hollywood tourism skews upper-income this quarter — nearly 30% of visitors come from households earning $150K or more, led by the >$200K bracket at 18.9%. Households under $35K make up 20% of visits.

Click to expand ↗

Top Source States — Q2 2026 (excl. CA)

Key Insight

Texas (103K) and New York (102K) lead Q2 2026 out-of-state visits to Hollywood, followed by Arizona, Florida, and Washington. California supplies 86.5% of all visits, so out-of-state travel sits on a deep regional base, reflecting Hollywood's national draw beyond the regional California base.

Click to expand ↗

Trailing 12 Months

Visitor Travel Patterns

Trailing 12 months ending Q2 2026 · Trip behavior by visitor distance from home

Avg Trip Duration

2.5 Days

Domestic tourists from 50+ miles spend an average of 2.5 days in Hollywood.

Visit Nights

1.1M

Total nights stayed by overnight visitors in the market.

Total Trips

1.1M

All trips (day + overnight, up to 60 days) from visitors 50+ miles from home.

Overnight Trip Length

  • 1 night69%
  • 2+ nights31%
  • 2–3 nights27%
  • 4–7 nights4%
  • 8+ nights0%

Day vs Overnight

  • Day Trips348.0K (33%)
  • Overnight Trips716.5K (67%)

Closer visitors are more likely to make a day trip.

Top Markets

1Los Angeles, CA 2San Francisco, CA 3New York, NY

—

Key Insight

—

Hotel Market Conditions

Data reflects year-to-date activity through Q2 2026

Q2 2026 was a strong quarter for Hollywood hotels. HED occupancy reached 74.7%, ahead of the Greater LA rate of 72.9%, and ADR of $239.14 came within a dollar of the 2018 record for a second quarter. Part of the year-over-year gain reflects a soft Q2 2025, but Hollywood grew demand while the broader Greater LA market lost it — and HED RevPAR growth of 13.3% was more than double the national rate of 5.7%.


Hollywood Entertainment District (HED)

Total Hotel Rooms

3.0K

17 Total Hotels

HED Occupancy Rate

74.7%

↑ +3.7pp YoY

HED Average ADR

$239.14

↑ +7.7% YoY

HED Average RevPAR

$178.61

↑ +13.3% YoY

HED Total Room Revenue

$49.3M

↑ +13.3% YoY

Greater Hollywood

4.6K Rooms · 50 Hotels

Total Room Revenue · Q2 2026

$66.7M

2025 Annual Total: $223.1M

Room Supply

418K

Room Nights

vs Q2 2025↓ −0.9%
vs Q1 2026↑ +0.8%

Room Demand

312K

Room Nights Sold · 74.7% Occ

vs Q2 2025↑ +3.0%
vs Q1 2026↑ +6.1%
RevPAR · Q2 2026 $159.69

Gr. Los Angeles

118.0K Rooms

Total Room Revenue · Q2 2026

$1.67B

2025 Annual Total: $6.1B

Room Supply

10.7M

Room Nights

vs Q2 2025↓ −1.4%
vs Q1 2026↑ +1.0%

Room Demand

7.8M

Room Nights Sold · 72.9% Occ

vs Q2 2025↓ −2.1%
vs Q1 2026↑ +3.8%
RevPAR · Q2 2026 $155.71

Hotel Occupancy Rate — Gr. Hollywood vs. Gr. Los Angeles

Greater Hollywood occupancy reached 74.7% in Q2 2026, ahead of the Greater LA rate (72.9%) and the strongest second quarter since 2023. Occupancy remains below the 80–83% range Hollywood held before 2020.

Click to expand ↗

Hotel Average Daily Rate — Gr. Hollywood vs. Gr. Los Angeles

Greater Hollywood ADR reached $213.87 in Q2 2026, the highest Q2 rate in the series and just above Greater LA ($213.50). But Hollywood's pre-2020 premium of roughly $25–30 a night over the region has all but disappeared.

Click to expand ↗

Regional Hotel ADR — Submarket Comparison

Q2 2008 – Q2 2026 · 8 submarkets · Click legend items to show/hide

Beverly Hills ($960.86) remains the regional luxury benchmark by a wide margin, with West Hollywood ($405.05) and Santa Monica ($393.04) forming a clear mid-luxury tier. Greater Hollywood ($213.87) now edges just ahead of the Greater LA average ($213.50), while sitting below DTLA ($233.91), Anaheim ($238.76) and Culver City ($223.98). Rate growth was broad across the region, with every submarket up between 6% and 16% year over year.

Click to expand ↗

Hollywood Hotel Market Over Time Q2 2015–2026

Q2 2026 RevPAR of $159.69 is Greater Hollywood's strongest showing since 2023 and a sharp recovery from last year's $143.41, though it still trails the 2017–2019 range of $162–164. Occupancy of 74.7% remains roughly eight points below the 2017 peak of 82.7%.

Click to expand ↗

—

Key Insight

—

Top Stories

LA Pride parade on Hollywood Boulevard

LA Pride Drives a Big Day for Hollywood (Q2 2026)

The 56th Annual LA Pride Parade brought Hollywood Boulevard to life on June 14, drawing more than 137,600 people to the Hollywood Entertainment District — 43% more than a typical day and 34% more than a typical Sunday. Visitors spent an average of 2.8 hours in the district, with attendees coming from across Los Angeles and well beyond: 39% traveled 10–250 miles and 31% came from more than 250 miles away.

Pride Village drew 31,000 daily visits, up 9% from 2025, while peak parade traffic brought an estimated 15,000 visits between 11 a.m. and 1 p.m. The results demonstrate the tangible impact major events can have on Hollywood, bringing people into the district and creating activity throughout the neighborhood.

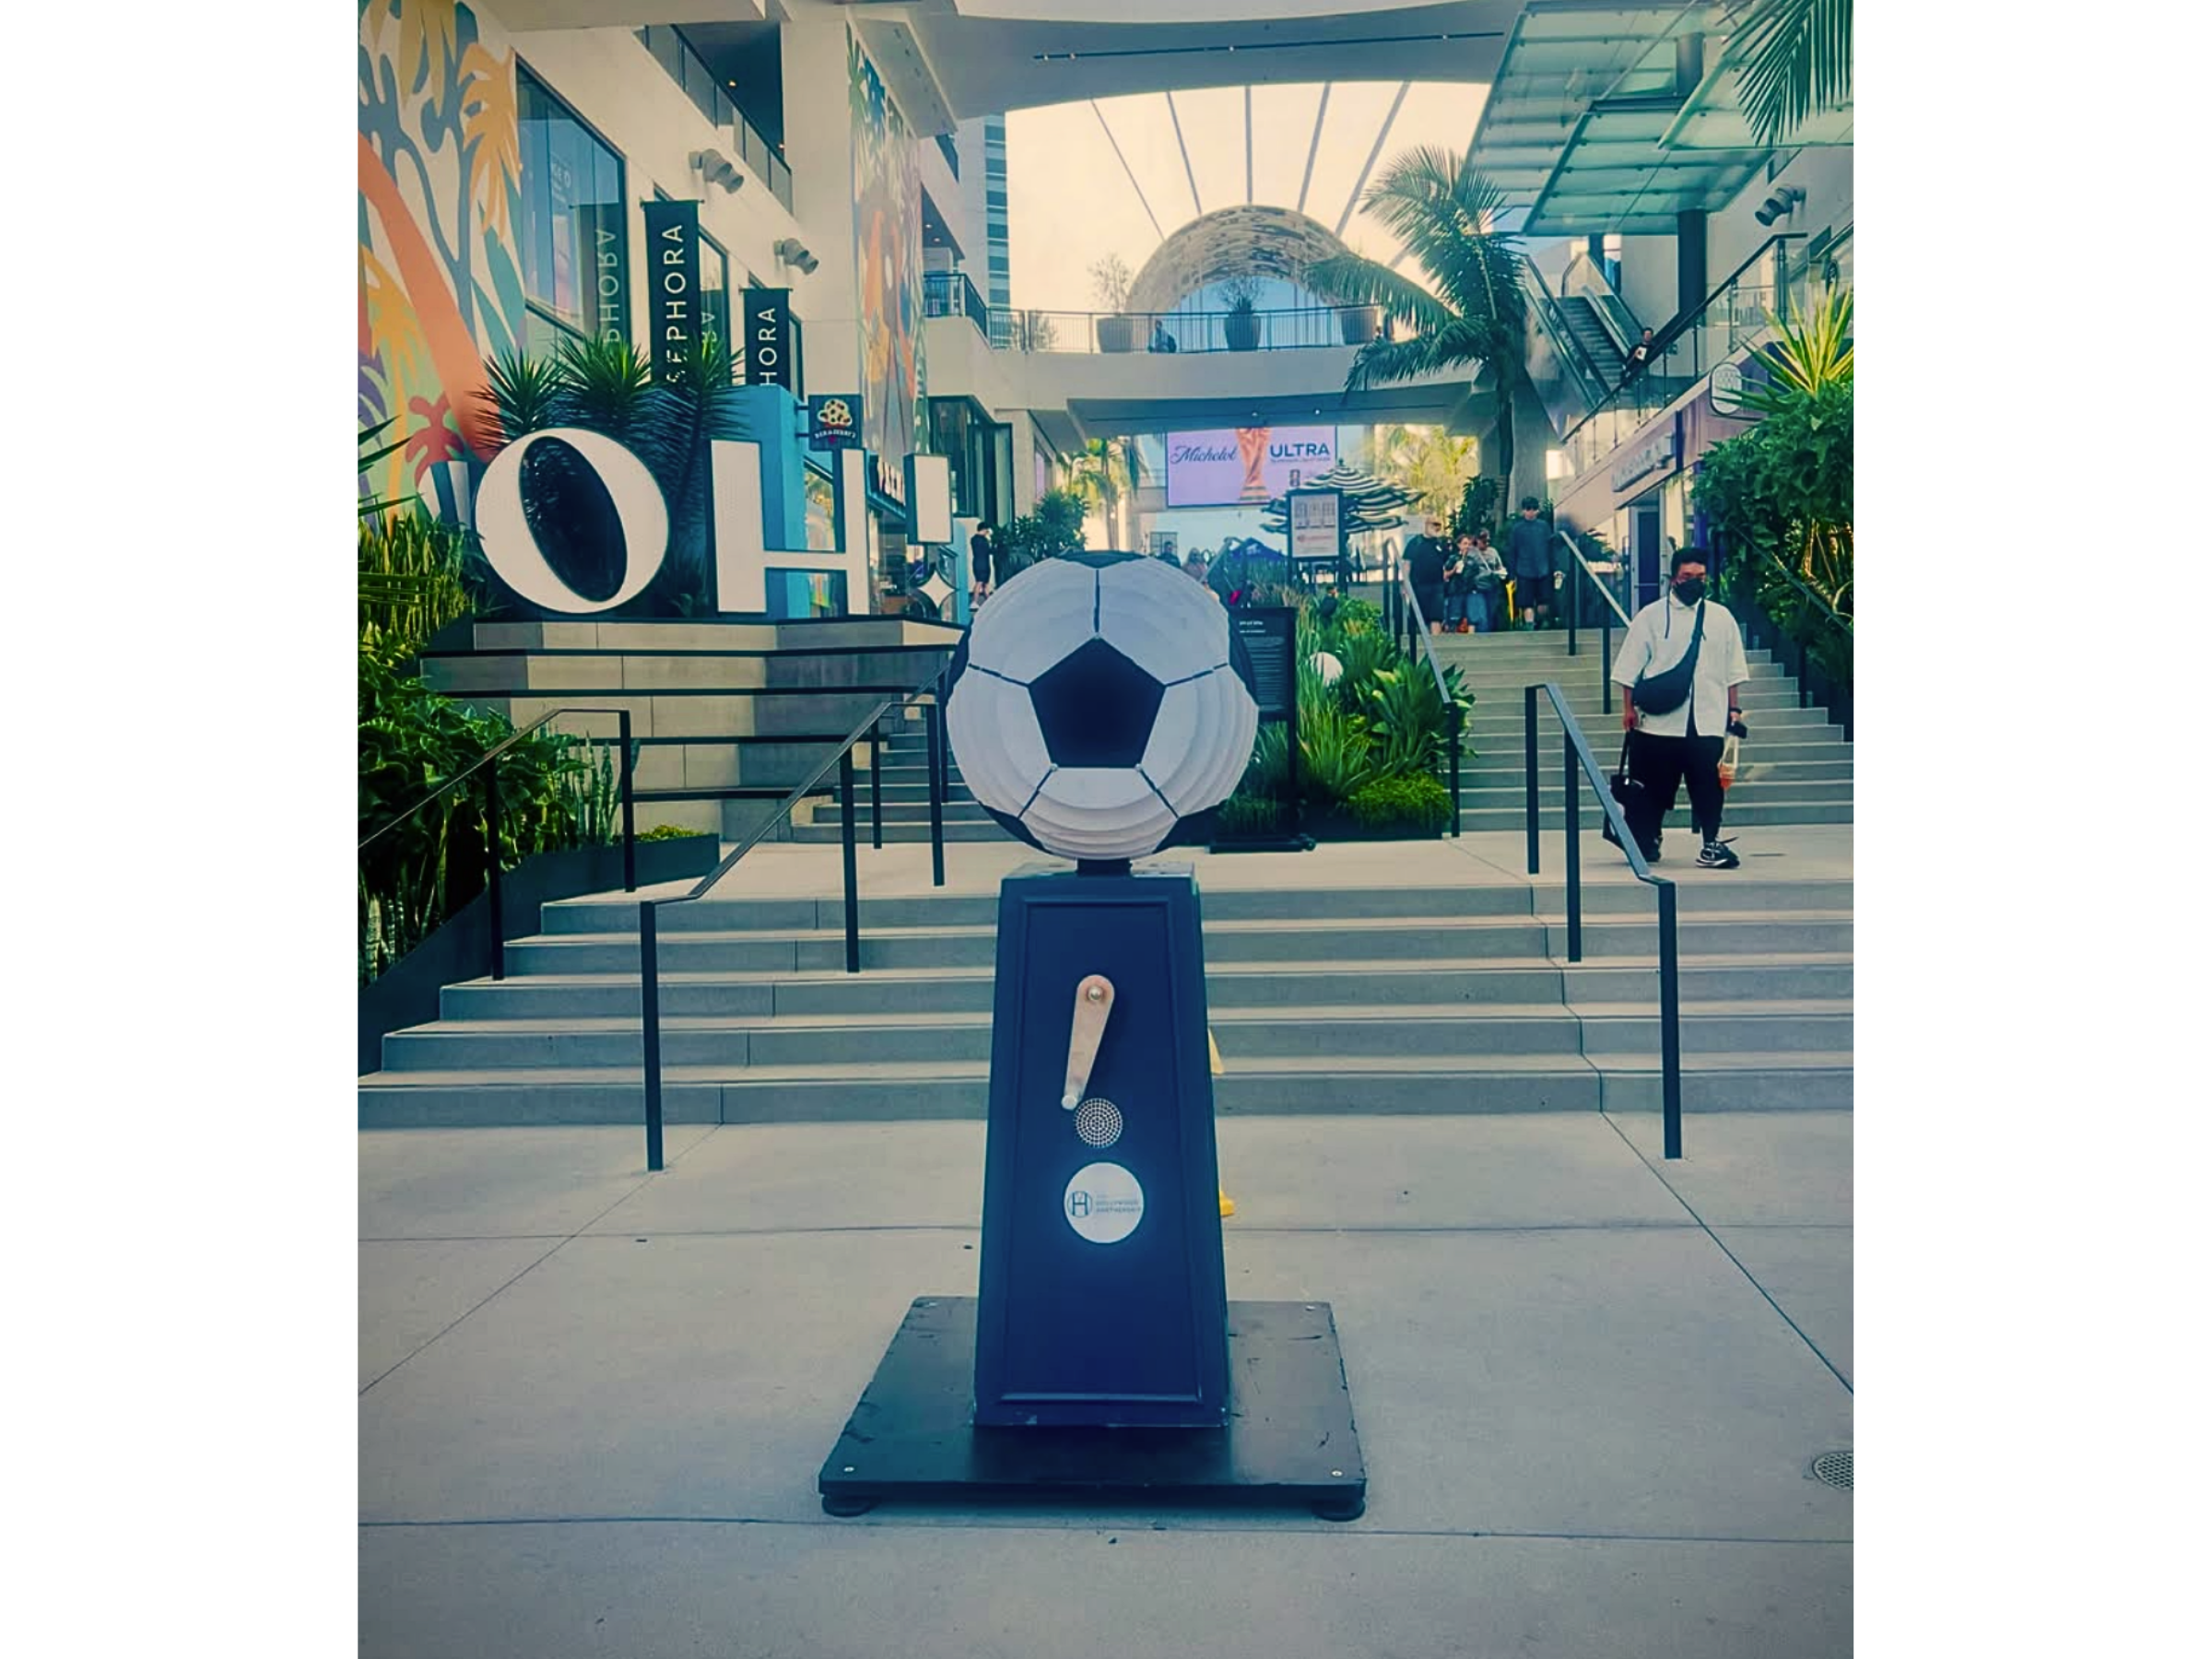
FIFA World Cup 26 in Hollywood

Hollywood During the World Cup (Q2 2026)

As Los Angeles hosted FIFA World Cup matches beginning in June, Greater Hollywood hotel room demand rose 3.0% year over year — in a quarter when demand across Greater Los Angeles fell 2.1%. June was also the district’s busiest month of the quarter for foot traffic, up 7.2%. Hollywood held onto visitors in a quarter when much of the region did not.

Hollywood Palladium marquee announcing the Vinyl Room

Vinyl Room at Palladium Opens (Q1 2026)

The Hollywood Palladium is expanding its role beyond concerts with the debut of the Vinyl Room, an intimate, reservations-only lounge concept tucked inside the historic venue. Programmed by Live Nation, the space is designed as a pre- and post-show hub as well as a standalone nightlife destination, featuring curated vinyl-focused DJ sets, a craft cocktail program and a design aesthetic that nods to the Palladium’s mid-century roots. Available for private and industry events, the Vinyl Room gives talent, labels and brands a smaller-format room on the same campus as the main ballroom, enhancing hospitality options for premieres, listening parties and receptions. The launch reflects a broader Hollywood trend of activating legacy entertainment properties with higher-margin food-and-beverage and experiential offerings that keep guests on-site longer and deepen fan engagement.

Concert crowd inside Avalon Hollywood

Insomniac’s $15.7M Avalon Investment (Q4 2025)

Insomniac has made a strategic brick‑and‑mortar play in Hollywood nightlife, acquiring the historic Avalon Hollywood for $15.7 million, or roughly $470 per square foot. The 33,400‑square‑foot, two‑story venue at 1735 Vine St., on the Hollywood & Vine corner, changes hands for the first time in about 50 years, purchased from longtime owner Ligny LLC. The deal follows a 2024 partnership under which Insomniac began programming events at Avalon; now, the electronic music powerhouse controls both operations and real estate. Opened in 1927 and famed for hosting the Beatles’ first West Coast performance in 1964, Avalon will be “reimagined” as a dedicated home for Insomniac brands including Dreamstate, Day Trip, Bassrush and Factory 93, with an emphasis on new weekly and community‑driven events that cement the site as a permanent dance‑music anchor in Hollywood.

Mural on the Hollywood Wax Museum

Hollywood’s Role in the Nation’s Most Museum‑Rich City (2025)

Los Angeles’ cultural infrastructure is a major, if under-appreciated, economic asset, with 841 museums and galleries countywide and more museums per capita than any other major U.S. city, including New York and Washington, D.C. Hollywood is a key piece of that ecosystem, clustering visitor‑driven and niche institutions that reinforce its global brand. The Hollywood Museum, Hollywood Heritage Museum, Museum of Death, Madame Tussauds, Hollywood Wax Museum, the L.A. Fire Department Museum, Medieval Torture Museum, Guinness World Records Museum, and Japan House LA sit within minutes of one another, with the Academy Museum of Motion Pictures just down the road. This density of attractions feeds foot traffic for nearby retail, dining, and hotels while supporting year‑round tourism.

Bar inside The Whisky Hotel

The Whisky Hotel Opens (Q1 2025)

The Whisky Hotel, by boutique hotelier and restaurateur Adolfo Suaya, is now open at 1717 Wilcox Ave, just half a block north of Hollywood Blvd. The 132-room hotel features rooftop dining with nearly 360-degree views of the Hollywood skyline, as well as a street-level restaurant. Rich, moody interiors set the stage for an unforgettable stay, with rooms designed for indulgence—plush bedding, Nespresso machines, and city or Hollywood Hills views. Each space blends European craftsmanship with cinematic style, offering marble writing desks, in-room whisky bars, and bathrooms with terrazzo floors and marble benches. Suaya stated, “The Whisky Hotel isn’t just a place to stay—it’s a destination, an experience,” adding that the hotel’s design elements and whisky selections have “been chosen with passion and precision.”

Visiting Data Sources: CoStar, Placer.ai, STR, The Hollywood Partnership, Urbanize LA, ZIMAS

RETAIL IN HOLLYWOOD

Hollywood's retail environment reflects the district's diversity of visitors, workers, and residents. From global flagship concepts to neighborhood dining and services, the retail landscape is shaped by high foot traffic, tourism demand, and a growing appetite for experiential offerings. This section examines spending patterns, market conditions, and the brands choosing Hollywood.

Data Geographies

Click to enlarge

Consumer Behaviors

Data reflects year-to-date activity through Q2 2026

Hollywood's consumer activity reflects a high-frequency urban market, where daily spending is driven by residents, workers, and visitors across dining, entertainment, travel, and convenience-based retail.


$4.45B

Annual Business Sales (HED)

+2.8% vs 2024 +$122M growth
Key Insight

Hollywood's retail economy continues expanding, driven by resident density and sustained destination appeal for regional visitors.

Avg. Annual Spend Per Person in HED
Grocery & Convenience$6,234
Entertainment & Travel$5,892
Dining Out$4,521
Services$3,156
Retail & Apparel$2,847

Retail Demand

$408.0M

Total Retail Demand in HED

Retail Demand is the district's "shopping budget" — an estimate of annual spending on retail goods and services.

The categories show where that spending is most concentrated.

Retail Demand by Industry

Grocery Store$215.2M
Dining Out$95.4M
Entertainment & Recreation$59.9M
Apparel & Services$38.0M

Who Shops Here? (Top Consumer Personas)

To make the data easier to picture, we translate Hollywood's top ESRI Tapestry segments into simple "who you'll actually meet on the street" personas. These aren't individual people — they're story-based profiles that represent the largest clusters of consumers in the district, based on shared lifestyle patterns and spending priorities.

Together, these personas help explain why demand is strongest for everyday essentials and dining — alongside major spending in entertainment and services.

40.9% of HED

Metro Renters

Tech-savvy young professionals renting urban life — walking, ridesharing, catching films, & jetting off when they can.

21.1% of HED

Trendsetters

Style-forward city singles with degrees and long commutes who choose organic, love their devices, and prioritize fitness.

20.7% of HED

Social Security Set

City-loving seniors on fixed incomes, comfortably rooted in affordable high-rises and urban routines.

6.9% of HED

Laptops & Lattes

Graduate-educated urban achievers in new builds — working remote with a passport in one hand and a podcast in the other.

Retail Market Conditions

Data reflects year-to-date activity through Q2 2026

Hollywood's retail market is tightening while much of the country holds flat. Vacancy fell two points year over year to 6.2%, asking rents rose 5.7% against 2.4% nationally, and net absorption was positive for a third consecutive quarter. Premium space continues to lead, and global brands continue to choose the district for marquee debuts — reframing Hollywood as a launchpad for experiential and high-quality retail.


HED Retail Inventory (SF)

3.1M

Total retail space

$3.11↑ +5.7% YoY
Avg. Monthly Rent PSF
6.2%↓ −2.0pp YoY
Vacancy Rate

Gr. Hollywood Retail Inventory (SF)

9.5M

Total retail space

$3.43↓ −2.0% YoY
Avg. Monthly Rent PSF
8.0%↑ +0.5pp YoY
Vacancy Rate

City of LA Retail Inventory (SF)

95.9M

Total retail space

$3.33↓ −3.6% YoY
Avg. Monthly Rent PSF
6.6%↑ +0.3pp YoY
Vacancy Rate

Q2 Retail Vacancy Rates Over Time (2016–2026)

HED retail vacancy fell to 6.2% in Q2 2026 — down 2.0 points from a year ago and 4.6 points from its Q2 2024 peak of 10.8%. Greater Hollywood (8.0%) and the City of LA (6.6%) both edged up, leaving the HED the tightest of the three.

Click to expand ↗

Hollywood's Retail Renaissance

Recent Business Openings in the HED

Quality establishments enhancing the vitality of the district — winning accolades and becoming part of Hollywood's identity.

Vinyl Room at the Palladium

6215 Sunset Blvd

Couplet Coffee

6318 Hollywood Blvd

Padi Espresso Bar & Indonesian Kitchen

6464 Sunset Blvd

Romaniccia — Pizza de Roma

1550 Cahuenga Blvd

Raising Cane's

6933 Hollywood Blvd

Bristol Farms

6220 Selma Ave

Grocery Outlet

6130 Sunset Blvd

ABL Hollywood

1649 Cahuenga Blvd

Retail Quality Ratings

The CoStar Building Rating System

CoStar ratings provide a consistent way to compare retail quality across markets. Ratings reflect factors like location, building quality, and tenant mix. Higher-rated centers often attract stronger demand, which can show up as lower vacancy and more resilient performance.


Hollywood Entertainment District

4–5 Star Retail 21%

Higher share of premium retail vs Gr. Hollywood (+6 pts) and City of LA (+12 pts)

1–3 Star Retail 79%

4–5 Star Vacancy

5.7%

✓

vs 6.3% for 1–3 Star

Market Signal

HED's premium retail share stands at 21% this quarter but still leads both comparison markets — +6 points ahead of Greater Hollywood and +12 points ahead of the City of LA. With 4–5 Star vacancy at 5.7% against 6.3% for 1–3 Star space, the district's premium tier continues to lead on demand.

How HED Compares

HED's 4–5 Star share vs. each area:

vs. Gr. Hollywood (15%)

HED is higher by +6 pts

vs. City of LA (9%)

HED is higher by +12 pts

HED's 4–5 Star retail share (21%) continues to outpace both Gr. Hollywood and the City of LA.

—

Key Insight

—

Top Stories

Vinyl Hollywood apartment community at 1540 Vine Street

Camden Hollywood Rebrands as Vinyl Hollywood

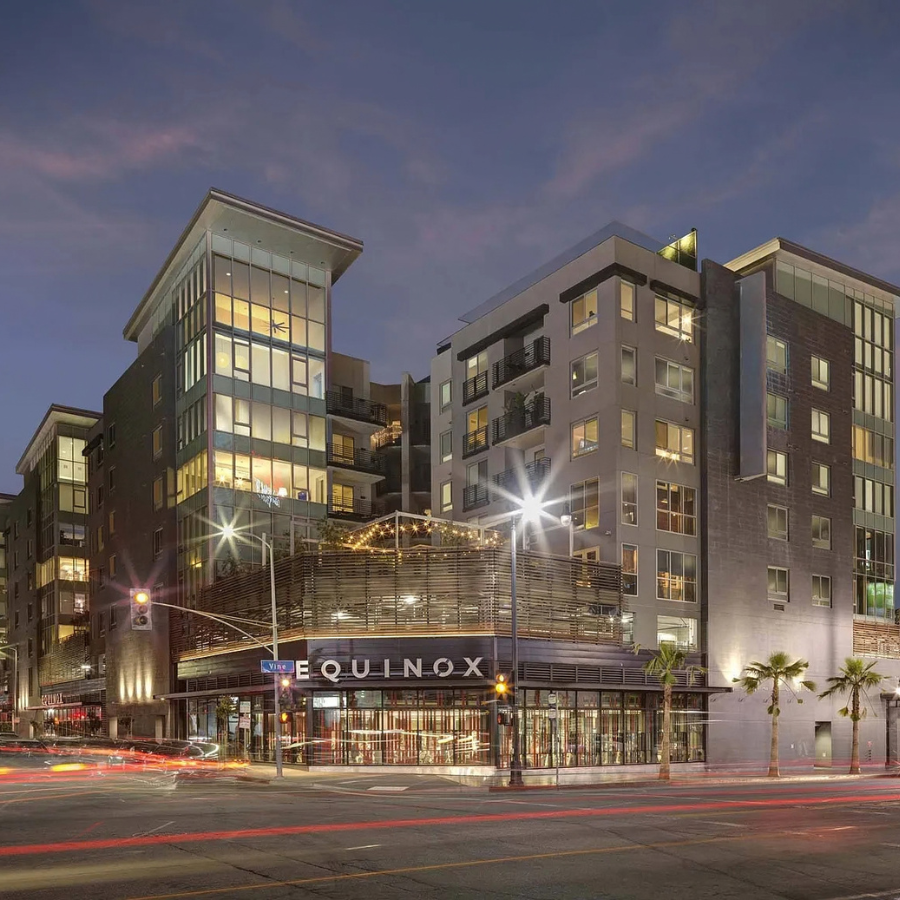
Camden Hollywood has a new name: Vinyl Hollywood, a rebrand that taps into the neighborhood’s deep roots in recording and live music. Located at 1540 Vine Street, the apartment community sits in the heart of Hollywood’s music and entertainment district, steps from legendary venues including the Hollywood Palladium and The Fonda Theatre. The music connection carries into the property itself, which features a private recording studio among its resident amenities. Vinyl is also home to an Equinox and is located near Trader Joe’s and the newly opened Bristol Farms, adding to the growing mix of everyday amenities serving Hollywood’s residential community.

Mott 32 restaurant interior

Mott 32 Is Coming to Hollywood (Q2 2026)

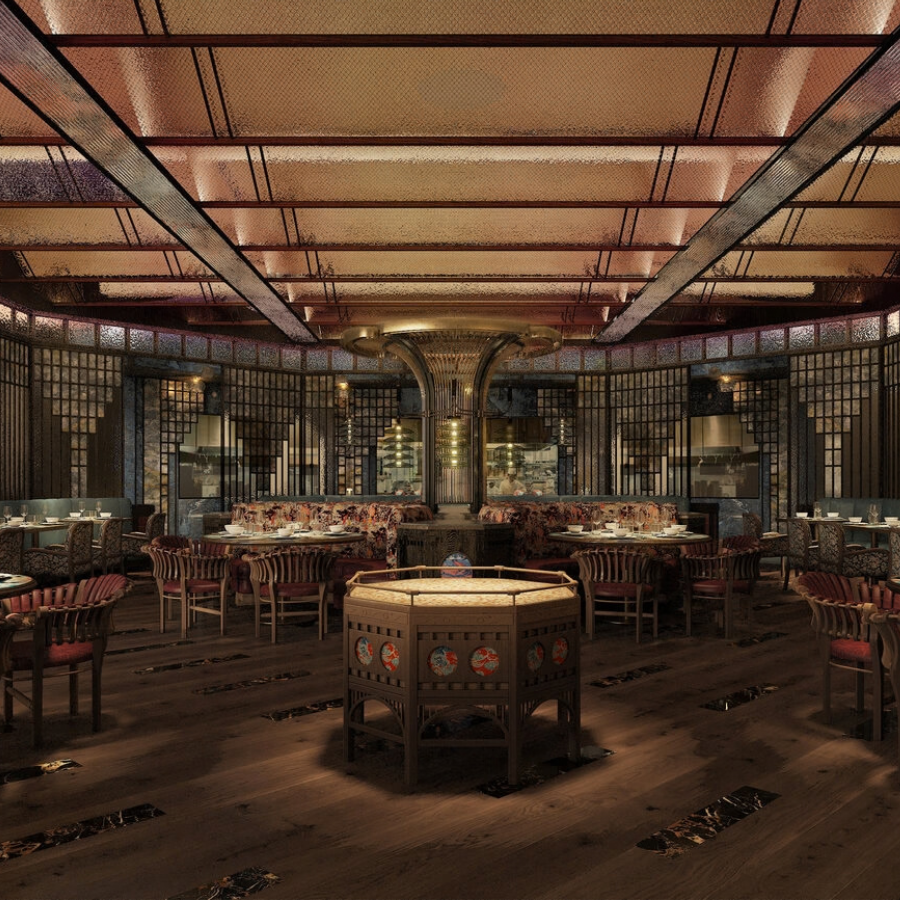
Hollywood is set to welcome another major international dining name with Mott 32, the award-winning Chinese restaurant brand with locations in Hong Kong, Las Vegas, Singapore, Dubai and other global destinations. The restaurant is coming to 1545 Wilcox Avenue, where it will occupy the second floor and bring its upscale take on Cantonese, Shanghai and Beijing cuisine to the neighborhood. Mott 32 currently lists its Los Angeles opening for 2027.

Source: Mott 32

ABL Hollywood restaurant

ABL Brings Jamaican-Chinese Cuisine to Hollywood (Q2 2026)

Hollywood’s dining scene welcomed a distinctive new addition in Q2 with the April opening of ABL Hollywood at 1649 N. Cahuenga Boulevard. Created by mother-daughter team Aja and Barbara Dawson, the intimate 35-seat restaurant explores the intersection of Jamaican and Chinese culinary traditions through dishes including oxtail lo mein, jerk-fried egg rolls and escovitch snapper. The new concept builds on the family’s A Beautiful Life restaurant while bringing a deeply personal and culturally rooted dining experience to Hollywood.

Source: Eater LA

Collage of Hollywood grocery stores

Hollywood’s Grocery Scene Is Having a Moment (Q2 2026)

Hollywood is a neighborhood of over 83,000 residents, 31,000 of them living within the Hollywood Entertainment District alone, at a residential density of 21,800 people per square mile. Grocery stores are not an afterthought here. They are infrastructure, gathering places, and increasingly, destinations in their own right. Here is what is new and what has always been worth your loyalty:

  • Sunset-Hollywood Grocery Outlet is now open and owned by a local! Stop in and celebrate.
  • Bristol Farms Hollywood Selma opened April 18th at 6220 Selma Ave (at Argyle) on the ground floor of the new Modera building.
  • Trader Joe's Hollywood is a beloved community anchor near Hollywood and Vine, and its queue moves faster than it looks.
  • Hollywood Farmers Market is in Hollywood every Sunday and is a cornerstone of the neighborhood's food culture for good reason.
  • Target on Hollywood Boulevard is a two-story urban store with a full grocery section anchoring the western end of the district at Hollywood and Orange.
  • Yucca Supermarket is a trusted local staple that has been serving the heart of the community for years.
Thermal pools at Bathhouse

Bathhouse Inks Lease: A New Wellness Anchor (Q1 2026)

Hollywood's Sunset Boulevard is getting a major experiential upgrade. Bathhouse, the community-focused wellness concept, is set to take over the former Amoeba Music building at 6400 Sunset, transforming the iconic 85,000-square-foot space into a social wellness destination slated to open in 2028. Founded by Travis Talmadge and Jason Goodman, Bathhouse launched in Brooklyn in 2019 and expanded to Manhattan's Flatiron district in 2024. The Hollywood location will be its largest yet, featuring seven saunas and steam rooms, roughly 10 thermal pools, and a 30,000-square-foot activated rooftop with views stretching from the Hollywood Sign to Santa Monica. For Hollywood's leasing and investment community, the deal signals growing demand for high-touch, experiential amenities that support employee recruitment and retention — reinforcing the neighborhood's position as a working creative hub.

Entrance hallway of the Vinyl Room at the Hollywood Palladium

Vinyl Room at Palladium Opens (Q1 2026)

The Hollywood Palladium is expanding its role beyond concerts with the debut of the Vinyl Room, an intimate, reservations-only lounge concept tucked inside the historic venue. Programmed by Live Nation, the space is designed as a pre- and post-show hub as well as a standalone nightlife destination, featuring curated vinyl-focused DJ sets, a craft cocktail program and a design aesthetic that nods to the Palladium’s mid-century roots. Available for private and industry events, the Vinyl Room gives talent, labels and brands a smaller-format room on the same campus as the main ballroom, enhancing hospitality options for premieres, listening parties and receptions. The launch reflects a broader Hollywood trend of activating legacy entertainment properties with higher-margin food-and-beverage and experiential offerings that keep guests on-site longer and deepen fan engagement.

Mixue storefront on the Walk of Fame

World’s Largest Chain Opens 1st US Location in Hollywood (Q4 2025)

China’s boba giant Mixue, the world’s largest chain with more than 47,000 locations worldwide, beating McDonald’s in global store count, has chosen Hollywood’s Walk of Fame for its first U.S. outpost, signaling a major bet on the American market. The storefront offers the brand’s signature soft-serve ice cream alongside fruit teas, milk teas, and coffee, all positioned at aggressively low price points, with most drinks under $5, a sharp contrast to typical Hollywood tourist pricing. A Mixue spokesperson said Hollywood was selected for its dual draw of year-round international visitors and local consumers, allowing the company to test broad demographic appeal in a single flagship location. The opening underscores Hollywood’s growing role as a launchpad for global consumer brands seeking high-visibility U.S. debuts.

Aerial view of Hollywood Galaxy

Hollywood Galaxy and Peterson Building Sold for $69M (Q2 2025)

Retail is buzzing in Hollywood with one of LA's biggest retail deals: the sale of Hollywood Galaxy at 7021 Hollywood Boulevard and the Peterson Building at 7001 Hollywood Boulevard for $69 million. The properties were purchased by brothers Justin and Tyler Mateen (Justin Mateen is a venture capitalist and co-founder of Tinder), who view this as an opportunity to curate these key retail locations, which include nearly 181,000 square feet of prime retail space located directly on the iconic Hollywood Walk of Fame. This landmark sale underscores strong investor confidence in Hollywood's vibrant, tourism-driven corridor.

Retail buildings on Hollywood Boulevard

Recent Significant Retail Property Sales in Hollywood (2024–2026)

HED Sales:

  • 1641-1644 Wilcox Ave (Sayer's Club) & 6500-6504 Hollywood Blvd, Sold Q1 2026 to J&J Dev
  • Hollywood Galaxy & Peterson Building, $69M, 181K SF, 7001 & 7021 Hollywood Blvd, Sold Q2 2025
  • 6616-6620 Hollywood Blvd, $4.35M Sale, 8,000 SF, 0% vac, Sold Q2 2025
  • 6601-6613 Sunset Blvd, $5.1M, 44.6% vac, Sold Q4 2024
  • 6670 Hollywood Blvd, $2.2M, 5,040 SF, 0% vac, Sold Q4 2024

Gr. Hollywood Sales:

  • 959 Gower, $2.9M, 3,590 SF, Sold Q2 2026
  • 812 Highland Ave, $2.5M, 2,576 SF, 0% vac, Sold Q2 2025
  • 1330 Highland, $1.35M, 2,160 SF, Sold Q1 2025

Retail Data Sources: CoStar, ESRI Business Analyst, Los Angeles Times, Placer.ai, The Hollywood Partnership, Urbanize LA

IN DEVELOPMENT

Development in the HED reflects how Hollywood continues to evolve as a place to live, work, and visit. From new office and residential projects to hotels that support the district's growing tourism base, the pipeline signals sustained investor confidence. This section tracks active projects across all asset classes and links to the full development matrix.

Data Geographies

Click to enlarge

Development At a Glance

Data reflects year-to-date activity through Q2 2026

A snapshot of active office, housing, and hotel projects currently shaping Hollywood’s streets and skyline.

Office Development
19
Projects in Development
14
Projects Under Construction or Entitled
GR. HWD3M SF
Office Space Under Construction or Entitled
HED1.9M SF
Within the HED
Multifamily Development
59
Projects in Development
43
Projects Under Construction or Entitled
GR. HWD8.1K Units
Under Construction or Entitled
HED4.3K Units
Within the HED
Hotel Development
8
Projects in Development
8
Projects Under Construction or Entitled
GR. HWD1.34K Rooms
Under Construction or Entitled
HED925 Rooms
Within the HED
Retail Development
45
Projects in Development
33
Projects Under Construction or Entitled
GR. HWD641.5K SF
Retail Under Construction or Entitled
HED347.2K SF
Within the HED

Retail development is included within a variety of mixed-use projects. Explore more details in the Development Map.

Totals reflect combined activity across Greater Hollywood, with the inner Hollywood Entertainment District (HED) figures shown as a subset.

GR. HWD Greater Hollywood
HED Hollywood Entertainment District

Development Matrix

A printable snapshot of active development projects in and around the HED.

Current File
HWD Development Matrix — Q2 2026
View / Print
HWD Development Matrix Q2 2026 Preview

Development Data Sources: City of Los Angeles, Los Angeles Times, The Hollywood Partnership, Urbanize LA, ZIMAS

DATA GEOGRAPHIES

A reference guide to the five boundaries behind the data on this dashboard. Knowing which boundary applies to a given metric puts the numbers in context — what they include, what they exclude, and how they relate to one another.

How They Relate

The Walk of Fame sits within the HED, which sits within Greater Hollywood. Most metrics use one of these as their scope.

Two specialty boundaries serve specific datasets: HED Census Tracts (for demographic data) closely mirrors the PBID but follows U.S. Census lines, while the Greater Hollywood Hotel Market is a CoStar/STR-defined submarket that overlaps but does not match Greater Hollywood proper.

Map of the Walk of Fame boundaries

Walk of Fame

Hollywood Boulevard from La Brea to Gower, plus Vine Street between Yucca and Sunset. Used for foot-traffic data specific to the Walk of Fame.

Used in

Snapshot Visiting
Map of the HED PBID boundary

HED PBID Boundaries

The Hollywood Entertainment District Property-Based Business Improvement District. Used for development tracking and visitation data.

Used in

Snapshot Development Visiting
Map of the HED Census Tract boundaries

HED Census Tract Boundaries

The U.S. Census tracts that approximate the HED footprint. Used for demographic data — residents, retail, tourists, and workforce.

Used in

Snapshot Working Living Retail Visiting
Map of the Greater Hollywood neighborhood boundaries

Greater Hollywood

The broader Hollywood neighborhood that surrounds the HED. Used for data referenced as "Greater Hollywood" or "Gr. HWD" outside the HED-specific metrics.

Used in

Working Living Visiting Retail Development
Map of the Greater Hollywood Hotel Market boundaries

Greater Hollywood Hotel Market

The CoStar/STR-defined Greater Hollywood hotel submarket, which differs slightly from Greater Hollywood proper. Used for all Greater Hollywood hotel data.

Used in

Visiting